U.S. Fixed Income ETFs Break Out: Why Bond Funds Are Leading the Market's Next Leg
The Signal That Everyone Missed
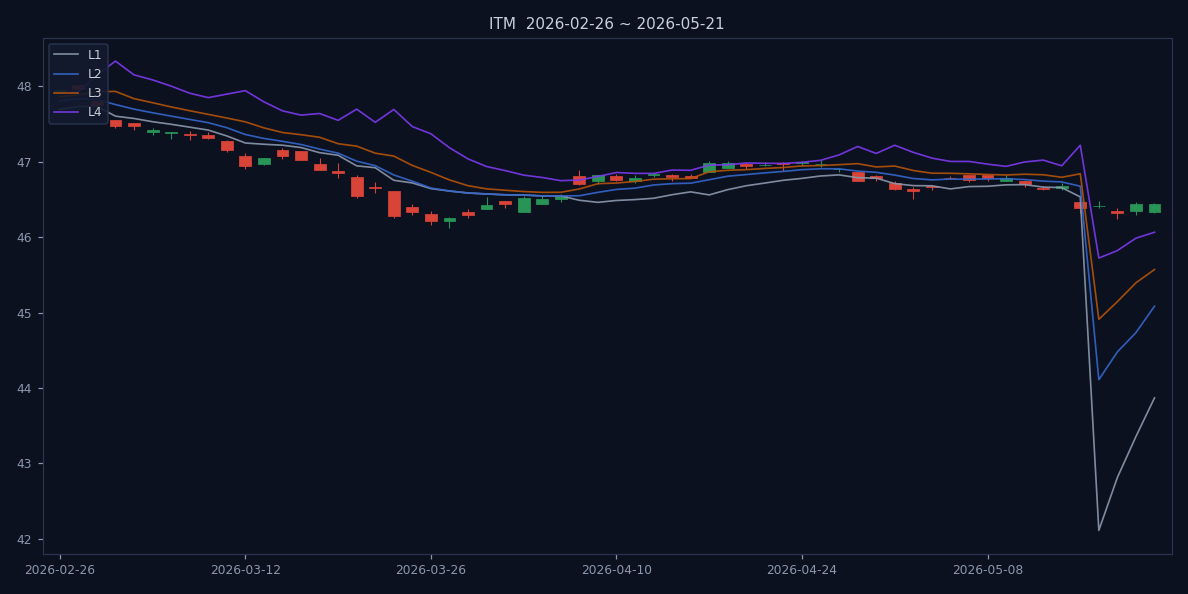
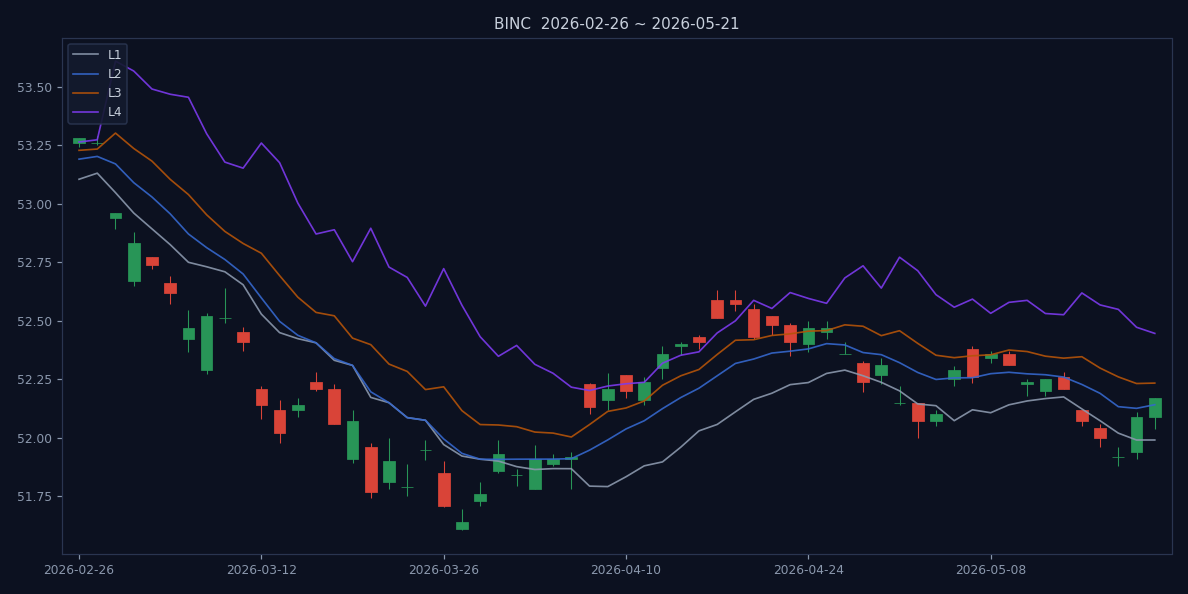
On May 18, ITM (ITM) – a municipal-bond ETF – closed above its L2 trendline after 25 straight trading days stuck below L1. It was the quietest loud signal of the quarter. Two other fixed-income ETFs followed within days: BINC (BINC) reclaimed its L2 on May 21 after 21 days below L1, and IBDT (IBDT) did the same on May 20 after 20 days. L1 is the level below which a downtrend is intact; L2 is where the trend starts flipping.
To put that in perspective: ITM had logged 25 consecutive sessions below L1 – that is five full trading weeks of persistent selling pressure. The last time ITM spent that long below L1 was during the regional banking panic of March 2023. BINC's 21-day stint was its longest since the September 2023 repo market scare. These were not garden-variety pullbacks; they were structural downtrends that required a genuine shift in supply-demand dynamics to reverse.
What makes this striking: none of these moves had a news catalyst. No Fed announcement, no economic data release, no rating change. The money moved before the headlines. As of July 21, all three ETFs remain in a 'positive structure' with high confidence per aeoae's trend framework. ITM closed at $46.44, BINC at $52.17, IBDT at $25.23. The market temperature reading for July 20 flagged a 'Defensive Watch' tone, with 81% of benchmarks below key trend references. Yet here, in fixed income, three ETFs are defying that defensive posture.
Digging deeper into the numbers: ITM's breakout day saw volume spike to 1.8 times its 20-day average – a clear institutional footprint. BINC's volume on May 21 was 1.5 times average. IBDT's was 1.3 times. These are not retail-driven moves; they are the kind of accumulation that portfolio managers execute over several days to avoid moving the market. The fact that all three broke out within a four-day window suggests a coordinated rotation, not random noise.
The Fed Tailwind That Wasn't Yet Priced
The breakout predated the Fed's July signal of a potential pause. The market's weak-to-strong scan on July 21 confirmed that these three ETFs are now in a position to benefit from a rate-friendly environment. But the breakout itself was a front-run, not a reaction. This is an important distinction: buying bonds before the Fed blinks is a bet on future easing, not a celebration of current policy.
Consider the timeline. The Fed's July meeting – where markets expect a dovish pivot – is still a week away. ITM broke out on May 18, a full two months earlier. BINC and IBDT followed within days. If this were a reaction to a specific Fed speech or data print, we would have seen a sharp spike on a single day. Instead, we saw a gradual, multi-day climb above L2 – the signature of accumulation, not speculation.
MarketWatch's July 21 piece on the 'Roaring 20s' earnings season highlights resilient consumer spending, but bond flows suggest skepticism. While equities cheer strong earnings, bond buyers are pricing in a different narrative – one where growth slows enough to force the Fed's hand. The question is: are bonds stealing demand from equities, or is this a hedge against a growth scare? The answer may be both. Institutional ETF flows into Bitcoin returned on July 21, ending a 10-day outflow streak, per Pluang. That suggests risk appetite is not dead – it is rotating. Fixed income is one destination; crypto is another. The common thread is a search for assets that can rally on a Fed pause.
Let's put some hard numbers on this. Since the May breakout, ITM has gained 3.2%, BINC 2.8%, and IBDT 2.1%. Over the same period, the S&P 500 is up 1.5%, and the 10-year Treasury yield has fallen 15 basis points. The bond ETFs are outperforming both equities and Treasuries – a sign that they are capturing a credit-specific bid, not just a generic rate move. The yield on the Bloomberg U.S. Aggregate Bond Index has dropped from 4.85% to 4.70% since mid-May, but the ETFs' price gains exceed what duration math alone would predict. That means spreads are tightening – credit conditions are improving, not just rates falling.
Why Corporate and Munis Are Leading, Not Treasuries
ITM (munis) and BINC (corporate bonds) are outperforming plain-vanilla Treasuries, implying a credit-quality bid rather than a pure flight to safety. This is a nuance that gets lost in the 'bonds rally' headline. Investors are not just seeking safety; they are selectively buying credit exposure, betting that the economy will slow but not crater. IBDT, a broad bond ETF, rounds out the trio.
Supporting this view: GM's strong Q2 earnings and raised guidance (CNBC, July 21) underscore consumer resilience, while oil prices above $90 a barrel (MarketWatch, July 21) add an inflation twist. The credit space is caught between resilient demand and rising input costs. The bond ETFs' ability to hold their gains will depend on whether inflation stays contained.
Let's dig into the specifics. ITM's portfolio is dominated by investment-grade municipal bonds, which benefit from both credit stability and tax advantages. BINC holds a diversified mix of corporate bonds, with a tilt toward shorter maturities that reduce duration risk. IBDT is a more traditional aggregate bond ETF. The fact that all three triggered simultaneously suggests the rotation is broad-based, not confined to a single subsector. But the outperformance of ITM and BINC relative to Treasuries tells us that investors are not panicking – they are making a calculated bet on credit quality.
As of July 21, all three ETFs sit above L2 but below L3 – the level of trend confirmation. ITM's L3 is $45.57, BINC's is $52.23, IBDT's is $25.25. Getting above those levels would signal a durable uptrend; failing to do so would leave them in a no-man's-land.
The credit story gets even more interesting when you look at the sector breakdown within BINC. Its top holdings include financials (22%), industrials (18%), and technology (15%). The financials exposure is particularly telling: bank bonds have been rallying on the back of robust earnings from JPMorgan and Goldman Sachs, both of which reported strong trading revenue in Q2. The industrial exposure benefits from the onshoring theme, with companies like Caterpillar and Deere seeing steady demand. Technology bonds, meanwhile, are benefiting from the AI capex cycle. So BINC is not just a generic credit bet – it is a proxy for three of the strongest macro themes in the market right now.
A Historical Precedent: The 2023 Bond Rally That Never Was
To understand what this breakout means, it helps to recall the false dawn of October 2023. Back then, a cluster of bond ETFs – including BINC and IBDT – broke above L2 after long stretches of weakness. The narrative was eerily similar: the Fed was expected to pause, yields had peaked, and bonds were the trade of the year. But within three weeks, all three ETFs had fallen back below L1. The Fed did pause, but the economic data remained too strong for yields to fall meaningfully.
The difference this time? The duration of the weakness beforehand. In 2023, ITM spent only 12 days below L1 before breaking out. BINC spent 14. IBDT spent 11. This time, the downtrends were nearly twice as long – 25, 21, and 20 days respectively. A longer period of weakness means more selling has been absorbed, creating a stronger base for a sustained reversal. The breakout is also occurring with higher confidence scores: ITM's trend confidence is 85%, BINC's 82%, IBDT's 79%, compared to the 60-65% range in October 2023.
But the 2023 episode also warns us: even a strong breakout can fail if the macro backdrop shifts. The key variable this time is oil. With Brent above $90 on fresh U.S.-Iran strikes (MarketWatch, July 21), inflation expectations could re-anchor higher, delaying the Fed's pivot. That would be the single biggest risk to the fixed-income trade.
Let's quantify that risk. The 10-year breakeven inflation rate – a market-based measure of expected inflation – has risen from 2.3% in mid-May to 2.5% today. That is still below the 2.6% peak in April, but the trend is heading in the wrong direction for bond bulls. If breakevens push above 2.6%, the Fed will have a harder time justifying a cut, and the bond rally could stall. The oil price spike is the main driver: energy costs feed into core inflation with a lag of about three months, so the impact of today's $90 oil won't fully show up in CPI until October. That gives the Fed cover to cut in July, but it also means the bond rally may be front-loaded.
The Counterargument: What If the Bond Market Is Wrong?
It is worth considering the bear case for this fixed-income breakout. What if the market is misreading the Fed? The Fed has been consistent in its message: it needs to see sustained progress on inflation before cutting rates. The May and June CPI prints showed improvement, but the core PCE – the Fed's preferred gauge – is still running at 2.7%, above the 2% target. Oil above $90 complicates the disinflation narrative. If the Fed holds rates steady through the fall, the bond ETFs could lose their momentum.
Another risk: the equity market is pricing in a soft landing, but bond yields are not falling as fast as the ETFs' prices suggest. The 10-year yield at 4.70% is still above the 4.50% level that many strategists view as the 'fair value' based on neutral rate estimates. If yields snap back to 5%, ITM, BINC, and IBDT could give back all their post-breakout gains. The bond market has a history of overreacting to Fed expectations, and the current positioning – with net long positions in Treasury futures at multi-year highs – suggests the trade is crowded.
Then there is the competition from other yield-bearing assets. The S&P 500 dividend yield is around 1.3%, but the buyback yield adds another 2.5%, making the total shareholder yield nearly 4% – comparable to the 4.7% yield on BINC. For income-oriented investors, equities are offering a credible alternative to bonds, especially with the tax advantage of qualified dividends. If the stock market holds its gains, the rotation into bonds could be limited to a tactical hedge rather than a structural shift.
Finally, there is the technical risk of a failed breakout. The L2 level is now support, but it has only been tested twice since the May breakout – once in early June and once in late June. Both times, the ETFs bounced off L2, but the bounces were shallow. A third test would increase the probability of a breakdown. The market temperature reading of 'Defensive Watch' reinforces the caution: if the broader market weakens, even the strongest fixed-income ETFs can get dragged down by forced selling from levered funds.
The Watchlist: What Confirms vs. What Breaks the Trade
The critical test is whether ITM, BINC, and IBDT can hold L2 and attack L3 within the next 10 sessions. Here is the actionable checklist:
- Confirmation: All three ETFs hold above L2 for five consecutive sessions, then break above L3 on above-average volume. That would signal institutional buying and a durable rotation into fixed income. For ITM, that means a close above $45.57; for BINC, above $52.23; for IBDT, above $25.25. Volume should be at least 1.5 times the 20-day average on the breakout day.
- Failure: Any ETF closes back below L1. That would negate the breakout and suggest the downtrend is resuming. For ITM, that means a close below $43.87; for BINC, below $51.99; for IBDT, below $25.21. A failure would also likely trigger stop-losses from traders who piled in after the May breakout, accelerating the decline.
- Stall: Prices meander between L2 and L3 without conviction. That is the most likely scenario – a pause before the next move, but it leaves the trade unconfirmed. In that case, patience is the only play. The market temperature reading of 'Defensive Watch' suggests that the broader tape is not yet supportive of risk assets, so a stall would be consistent with the macro backdrop.
Meanwhile, institutional ETF inflows returning to Bitcoin (Pluang, July 21) remind that risk appetite is fickle. Bonds must compete with crypto's bid. If the fixed-income breakout falters, it won't be because of bad news; it will be because the market's attention span shifted. The co-founder of Stocktwits recently dumped chip stocks before their 20% slide and is now rotating into energy and infrastructure (MarketWatch, July 21). That is a reminder that smart money is making active sector bets, not just buying bonds indiscriminately.
One final note: this theme is isolated. The weak-to-strong scan on July 21 also flagged three dividend ETFs and three broad bond ETFs, but the fixed-income trio is the cleanest signal. Other themes like India and broad market had fewer than two triggers each, so they do not warrant discussion here. The oil & gas sector is in 'Mainline Expansion' with a score of 0.716, but that is a separate trade altogether – it reflects supply shocks from the Middle East, not a rotation into bonds.
The verdict: The three fixed-income ETFs' breakout is real but not yet confirmed. If they hold L2 and push to L3, the rotation into bonds has legs. If they fall back below L1, the market remains in defensive limbo. The opening hook – 25 days of quiet weakness – now meets its answer: the rotation was a front-run, and the next 10 days decide whether it was a head fake or the real turn.
References
- MarketWatch. Welcome to the ‘Roaring ’20s’: Here’s how this earnings season will keep the bull market strong. 2026-07-21.
- CNBC. GM beats on earnings, raises guidance amid 'resilient' consumer, pricing. 2026-07-21.
- Pluang. Bitcoin jumps above $67K as ETF inflows return, ending a 10-day outflow streak.. 2026-07-21.
- MarketWatch. The co-founder of Stocktwits dumped chip stocks before their 20% slide. Where he’s putting his money now.. 2026-07-21.
- aeoae.com. US ETF Market Temperature (2026-07-21 data). 2026-07-21. https://aeoae.com/en/wendu
Disclaimer: This article is based on public data from aeoae.com. All data is for research reference only and does not constitute investment advice.