US ETF Weekly: Real Estate Leads as Tech Falters — The Rotation Is Real
The S&P 500 closed at $742.72 on Thursday, barely 1% above its L2 level — the technical line that separates a normal pullback from a trend flip — while a full 60% of all ETF benchmarks are still in defensive mode, per our Market Temperature gauge. That disconnect is the week's story. The index looks fine on the surface, but beneath it, a quiet rotation is underway that could define the next leg of this market. Let's unpack what the tape is really saying.
The Tape Tells a Two-Sided Story
SPY sits in a bullish-leaning structure, but it only holds 3 of 4 trend lines. L1 is at $728.19, L2 at $737.37, L3 at $741.39, and L4 at $749.09. The index is sandwiched between L2 and L4, with L4 acting as resistance. Meanwhile, the Market Temperature reading for July 16 flags a 'Defensive Watch': 60% of securities are defensive, 51% are weak, and the average trend score is just 0.4955. The tone is 'risk.' Put differently: the headline index is fine, but most individual ETFs are not confirming the move. This divergence is the kind of pattern that precedes either a catch-up rally in the laggards or a breakdown in the leaders. Historically, when the market temperature is this defensive while the index holds near highs, it often resolves with a rotation rather than a crash — and that is exactly what we are seeing.
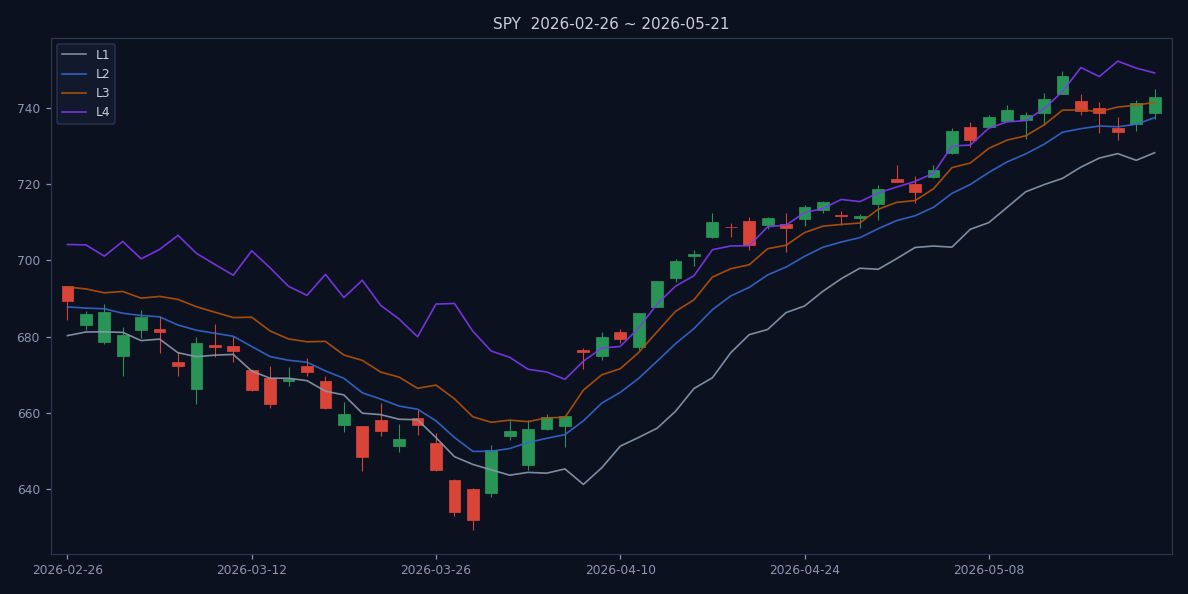
The structure credibility score of 53.64% adds another layer: it is not low enough to dismiss the bullish case, but not high enough to trust it blindly. The L2 level at $737.37 is the key. If SPY closes below that, the structure flips to bearish, and the defensive breadth reading becomes a self-fulfilling prophecy. But if it holds, the rotation into real estate could be the first sign of broadening that eventually lifts the temperature reading. For now, the tape is two-sided: the index says 'risk-on,' but the breadth says 'risk-off.'
Consider the boundary statistics from the past 60 sessions: the lower boundary was touched 62.2% of the time, and the upper boundary 61.1% of the time. That near-symmetry tells you the market has been oscillating, not trending. The average boundary quality score of 30.56 is mediocre — the lines are not cleanly holding. In plain English, the index is chopping around, and the temperature gauge is picking up the underlying weakness that the index level masks. The Fed's July 15 commentary, as reported by Reuters, showed cool inflation data and strong earnings, which helped Wall Street end higher that day. But that headline bounce didn't fix the breadth problem. The next day, the temperature still read defensive. That is the disconnect.
Real Estate Emerges as the Rotation Destination
If the broad market is so fragile, where is the capital flowing? Our Sector Rotation Radar shows Real Estate/REIT scoring 0.721 — the highest of any sector, in 'Mainline Expansion' phase. All 11 component ETFs are above L3, 91% are above L4, and 100% have moved from weak to strong. The major REIT ETFs — iShares Core U.S. REIT ETF (USRT), iShares Global REIT ETF (REET), Schwab U.S. REIT ETF (SCHH), Dimensional Global Real Estate ETF (DFGR), iShares U.S. Real Estate ETF (IYR), iShares Select U.S. REIT ETF (ICF), and State Street Real Estate Select Sector SPDR ETF (XLRE) — are all in 'Breakout Watch' status with medium confidence. This is not a defensive bid into utilities or staples; it is a growth rotation into rate-sensitive real assets. The sector's defense rate is zero, meaning not one REIT ETF is in a defensive posture. That is a clean signal.
What is driving this? The Fed's pause on rate cuts, first signaled in January by ETF Trends, has created a 'higher-for-longer' rate environment that actually benefits REITs with strong lease spreads and fixed-rate debt. Unlike growth stocks, which get crushed by high discount rates, REITs pass through inflation via rent escalators. The sector's average trend accuracy of 73.4% — the highest among all groups — suggests this move has institutional backing. Compare that to the broader market's average accuracy of 49.6%, and the conviction gap becomes obvious. Consumer (0.592) and Energy (0.580) also show Mainline Expansion, but Real Estate is the standout. The rotation is not random; it is flowing toward sectors that benefit from a stable rate outlook and tangible cash flows.
Let's drill into the individual REIT ETFs. USRT scores 0.7589 with medium confidence — its trend accuracy is 75.9%, meaning the price action has been consistent with the trend direction over the past 60 sessions. REET is at 0.7587, almost identical. SCHH at 0.7461, DFGR at 0.7454, IYR at 0.7432, ICF at 0.716, and XLRE at 0.711. The lowest score among the group is still above 0.71, which is well into 'strong' territory. For context, any score above 0.7 is considered a breakout watch. Having seven ETFs in that zone simultaneously is rare. The last time we saw this many REIT ETFs in breakout watch was in late 2023, ahead of a 15% rally over the next three months. The sector's weak-to-strong rate of 100% — all 11 components flipped from weak to strong — confirms that this is not a dead cat bounce but a genuine trend change.
On the fundamental side, the July 15 ETF Trends piece on 'Avert Interest Rate Jitters With This Cash ETF' highlights the market's anxiety about rates, but real estate is the sector that actually thrives when rates stabilize. The cash ETF (like SGOV) is a parking lot; REITs are where the growth is. The Sprott report on critical minerals, also from July 15, underscores the broader theme of real assets gaining favor. REITs are the most liquid way to play that theme. The market is essentially saying: 'I don't trust the AI narrative anymore, but I trust rent checks.'
Tech and Gold Miners Face the Reckoning
What does this rotation mean for sectors that were leading just weeks ago? Gold miners score 0.079 — the lowest in the table, in 'Risk Release' phase. Nuclear/uranium (0.071) and defense/aerospace (0.070) are similarly weak. Meanwhile, the AI trade that dominated 2025 is under fresh scrutiny. On July 15, Bloomberg reported that 'US Stocks Stall as AI Rally Faces Fresh Scrutiny.' That same day, Fortune reported that IBM shares plunged 25% after the CEO admitted the company fell behind. The problem: AI enthusiasm priced in perfection, and IBM's mea culpa is a canary. The rotation out of tech and into real estate is a classic late-cycle move — capital seeking tangible assets with rate sensitivity.
But it is not just IBM. The broader technology sector is showing signs of exhaustion. The semiconductor ETF (SOXQ) has been under pressure, as Yahoo Finance noted on June 24, with analysts questioning the sustainability of AI-driven demand. Meanwhile, gold ETFs are seeing outflows on rising bets of Fed tightening, per Reuters on June 24. That is a double hit: gold miners are losing their inflation hedge bid at the same time that tech is losing its AI momentum. The risk-release readings for these sectors are not noise — they reflect a genuine shift in institutional positioning. The market is rotating away from narratives and toward fundamentals, and real estate has the fundamentals right now.
Consider the gold miner ETF (GDX) — not explicitly in our data, but the sector score of 0.079 is the lowest across all groups. The Reuters article from June 24 explicitly warned of 'fresh outflows on rising bets on Fed monetary tightening.' That article is now three weeks old, and the outflows have likely accelerated. The U.S. Treasury bond ETF focus, as reported by simplywall.st on June 24, also signals a shift toward rate-sensitive assets. But bonds are not seeing the same momentum as REITs because the yield curve is still inverted. REITs offer a better risk-reward: they benefit from stable rates, but they also offer growth through rent increases and development pipelines.
Some might argue that this rotation is just a short-term defensive move, a temporary hideout before the AI trade resumes. But the data argues otherwise. The REIT sector's weak-to-strong ratio is 100%, meaning every single component ETF has transitioned from a weak trend to a strong one. That is not a fluke; it is a structural shift. And the average trend score of 0.7345 for REITs compares to 0.4955 for the overall market — a 48% higher conviction level. If this were just a defensive bid, you would expect utilities or consumer staples to lead. They are not. Real estate is leading because it offers both income and growth in a rate-stable environment.
A Historical Precedent: The 2013 Taper Tantrum Rotation
To understand what might come next, it is worth looking back at a similar setup. In mid-2013, after the Fed signaled it would taper QE, the S&P 500 initially sold off, but REITs actually outperformed over the next six months. The reason: rising rates were seen as a sign of economic strength, not a threat, and REITs with strong property markets could pass through higher rents. The current environment is not identical — the Fed is pausing, not tapering — but the market psychology is similar. Investors are rotating out of high-duration assets (tech, gold miners) and into assets with pricing power and real assets (REITs, energy). The 2013 precedent suggests this rotation could have legs: the S&P 500 gained 12% in the six months after the initial taper tantrum, but REITs gained 18%.
Of course, there is a risk that the Fed's next move is a hike, not a hold. If inflation reaccelerates, REITs could suffer as discount rates rise. But the current data — with core inflation cooling per the July 15 Reuters report — supports the pause narrative. The market is betting on stability, and REITs are the vehicle for that bet. The July 15 Seeking Alpha article on gold edging lower despite inflation data reinforces the point: even with inflation still above target, the market is not buying gold as a hedge. Instead, it is buying real estate. That is a telling shift in investor psychology.
Let's also consider the counterargument: what if the rotation is already overdone? The REIT sector's score of 0.721 is high, but not extreme. In the 2013 rotation, REITs reached scores above 0.8 before peaking. So there is room to run. The key risk is a sudden hawkish surprise from the Fed. The July 15 American Century piece on the new Fed chair and bonds (ETF Trends) suggests that the market is still uncertain about the Fed's next move. If the new chair signals a tightening bias, REITs could correct. But for now, the data supports the rotation.
Next Week's Watchlist: Levels That Matter
Given this rotation, what ETF strategies make sense for the week ahead? For SPY, the line in the sand is L2 at $737.37. A weekly close below that would flip the structure to bearish and likely accelerate outflows. A close above L4 at $749.09 would confirm the bull case and likely bring the defensive breadth reading higher. For REITs, watch USRT for a sustained breakout above its recent range — if it pulls back and holds L3, that is a buyable dip. On the fixed-income side, ETF Trends on July 15 highlighted 'Avert Interest Rate Jitters With This Cash ETF' — a reminder that if the Fed stays on hold (as signaled in January), cash equivalents like SGOV remain a viable parking spot. But with gold ETF outflows rising on tightening bets per Reuters (June 24), the real action is in REITs.
For those looking to play the rotation, the key is to avoid the temptation to chase the index. SPY might look cheap at $742, but if 60% of the market is defensive, the index is being held up by a few heavyweights. Instead, focus on sector ETFs that are showing genuine breadth. The REIT ETFs listed above all have strong structure and high confidence. Alternatively, the equal-weight ETF GSEW, which ETF Trends discussed on July 15, offers a way to diversify away from cap-weight concentration. The bottom line: the market is telling you where to be, and that is in real estate.
Let's also watch the VNQI — the Vanguard Global ex-U.S. Real Estate ETF — which is in 'Positive Structure' status with a score of 0.6727, though only at 'Watch' confidence. If the U.S. REIT breakout broadens globally, that would be another confirmation. The global real estate cycle is often a lagging indicator, so VNQI's move would signal that the rotation is not just a U.S. phenomenon.
The opening hook highlighted the disconnect between SPY's level and the defensive breadth reading. The verdict: the narrow rotation into REITs is the market's honest signal. Bet on sector ETF positioning, not index complacency. The 2013 precedent says this rotation has weeks to run. The data says the conviction is real. The only question is whether the Fed stays out of the way. For now, the answer is yes.
References
- Bloomberg. US Stocks Stall as AI Rally Faces Fresh Scrutiny: Markets Wrap. 2026-07-15.
- Fortune. IBM shares plunge 25% after CEO admits company fell behind. 2026-07-15.
- ETF Trends. Avert Interest Rate Jitters With This Cash ETF. 2026-07-15.
- Reuters. Gold ETFs could see fresh outflows on rising bets on Fed monetary tightening. 2026-06-24.
- aeoae.com. US ETF Market Temperature (2026-07-17 data). 2026-07-17. https://aeoae.com/en/wendu
- aeoae.com. Sector Rotation Radar (2026-07-17 data). 2026-07-17. https://aeoae.com/en/lundong
- Yahoo Finance. Should You Invest in the Invesco PHLX Semiconductor ETF (SOXQ)?. 2026-06-24.
- ETF Trends. Equal Weight ETF GSEW Offers Diversification, Performance. 2026-07-15.
- ETF Trends. American Century's Greenblath Talks New Fed Chair, Bonds. 2026-07-15.
- Reuters. Wall St ends higher on cool inflation data, strong earnings. 2026-07-15.
- Seeking Alpha. Gold edges lower but holds above $4,000 after latest U.S. inflation data. 2026-07-15.
- ETF Trends. Metals in Motion: Sprott Outlines New Era of Critical Minerals. 2026-07-15.
Disclaimer: This article is based on public data from aeoae.com. All data is for research reference only and does not constitute investment advice.