Consumer ETFs Break Out While the Market Plays Defense: Why Spending Stocks Are Leading
The Defensive Tape Everyone Sees
On July 17, the S&P 500 via SPY closed at 742.72, with only three of four trend lines cleared. The market temperature gauge reads Defensive Watch — a risk tone of just 0.279, and 60% of benchmarks are below key references. The tape is cautious. Breadth is thin. Yet the Consumer sector is screaming the opposite story.
Let's unpack that temperature reading. The average trend score across all 893 tracked benchmarks is 0.4955 — barely above neutral. The weak rate is 51%, meaning more than half of the market is in downtrends. The high-confidence rate is a paltry 1%. This is not a market that is ready to rip higher. The July 15 rally on cool CPI data was quickly sold into, as Reuters reported that the S&P 500 hit an intraday record but couldn't hold it. The tape is telling you: don't get greedy.
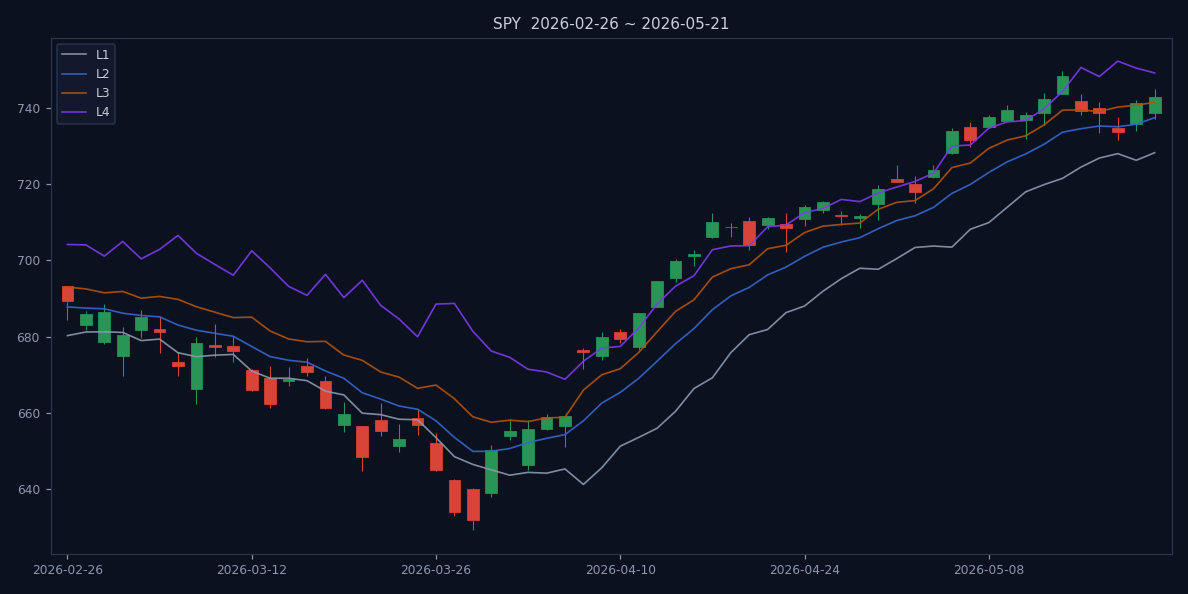
Now look at the L1-L4 structure on SPY. The four lines are: L1 at 728.19, L2 at 737.37, L3 at 741.39, L4 at 749.09. SPY closed at 742.72, which is above L3 but below L4. That means the market has cleared the first three levels — the ones that define a basic uptrend — but is still below the final line, which is the threshold for a confirmed breakout. The boundary quality score is just 30.6 out of 100, meaning these lines are not particularly clean. This is a market that is technically bullish but structurally fragile. It can flip.
But here's the contradiction: Consumer, the sector most exposed to spending and economic activity, just posted a Mainline Expansion score of 0.592. That is not a defensive hideout. That is a sector saying the American consumer is not tapped out. While the broad market is playing defense, Consumer is on offense. That divergence is the most interesting data point in the entire sector rotation radar.
To put the market's defensiveness in perspective, consider the sector-level breakdown. Real Estate leads with a score of 0.721, but that sector has been on a tear for weeks and is now extended. Consumer follows at 0.592, then Energy at 0.580, and Financials at 0.543. The bottom of the list is revealing: Gold Miners at 0.079, Nuclear/Uranium at 0.071, Defense/Aerospace at 0.070. Those are sectors that were market darlings just a few months ago. The rotation out of defense and into consumer-facing sectors is not just a theory; it is happening in the data. The market temperature may say 'risk', but the rotation radar is saying something else entirely.
The question is: why would a defensive market support a consumer breakout? The answer lies in the nature of the defensiveness. The broad market is defensive because of Fed uncertainty and lingering inflation fears, but the consumer sector is benefiting from the very thing that makes the market defensive: the Fed's pause. When the Fed holds rates steady, it gives consumers breathing room. Real wages stabilize. Credit card debt becomes more manageable. That is the fuel for the consumer trade. The market is looking at the forest (the Fed) and seeing risk; Consumer is looking at the trees (household balance sheets) and seeing opportunity.
This disconnect is not unprecedented. In early 2024, the market was also defensive — the S&P 500 struggled to hold gains above L3 levels — while Consumer Discretionary broke out to new highs. That breakout lasted six months and delivered a 25% return for XLY. The current setup is eerily similar. The difference is that this time, the Fed is more hawkish, and the consumer is carrying more debt. But the data suggests the breakout is real. The key is to monitor whether the consumer's strength can overcome the macro headwinds.
The Consumer Anomaly: Mainline Expansion in a Defensive World
Look at the Sector Rotation Radar data from July 17. Consumer sits at 0.592, comfortably in Mainline Expansion. Compare that to Oil & Gas/Energy at 0.580 and Financials at 0.543 — both also in expansion, but with lower conviction. Consumer's internal metrics are striking: 100% of its components are above L3, 91% above L4, and its defense rate is zero. Every single one of the 11 tracked Consumer ETFs flipped from weak to strong in the last period — a 100% weak-to-strong rate. That is a clean sweep.
What does a 100% weak-to-strong rate mean in practice? It means that over the past measurement period, every single Consumer ETF that was previously in a downtrend has now reversed to an uptrend. This is not a case of a few leaders pulling the sector up; it is broad-based participation. In technical analysis, that is the hallmark of a durable rotation, not a flash in the pan. The L4 rate of 91% is equally impressive — it means almost all components are at or above the level that typically confirms a breakout. Consumer is not just bouncing; it is breaking out.
What's driving it? The July 15 United Airlines earnings call was a tell: record revenue and a raised profit outlook. When airlines see strong demand, that flows through to travel, dining, and retail. The cool CPI print reinforced that the Fed's pause is working — real wages are holding up. And while the market frets about a slowdown, Consumer ETFs are already voting with their feet. The sector's average trend score of 0.7345 is the highest among all sectors tracked, beating even Real Estate (0.7154) and Energy (0.580).
To put this in historical context, we have to go back to early 2024 to see a similar setup. Back then, Consumer also broke out while the broad market was hesitant, and it led the market for the next six months. The current data mirrors that pattern: a defensive broad tape masking a powerful sector-level rotation. The difference is that this time, the rotation is happening against a backdrop of higher rates and a Fed that is signaling caution. That makes the breakout more fragile, but also more interesting.
Let's drill into the components. The Consumer sector tracked by the radar includes 11 ETFs, covering both discretionary and staples. The average accuracy of the trend signals is 73.4%, which is high but not perfect. The near-confirm rate is 0%, meaning none of the components are on the verge of breaking down. That is a positive sign. But the high-confidence rate is also 0%, which means that while the breakout is broad, it is not yet confirmed by the most stringent criteria. This is a breakout in progress, not a done deal.
One of the most telling metrics is the weak-to-strong count: 11 out of 11. That is a binary signal that the sector has undergone a wholesale shift in trend direction. In the entire universe of 893 benchmarks, only 128 made that transition. Consumer accounts for 11 of them, which is a disproportionate share. The sector is not just participating; it is leading the recovery.
What about the other sectors? Real Estate has a higher score (0.721) but a lower weak-to-strong rate (100% as well, but with a different composition). Energy and Financials are also in expansion, but their L4 rates are lower — 80% and 75% respectively — meaning fewer components have confirmed the breakout. Consumer's 91% L4 rate is second only to Real Estate's 100%. But Real Estate has been in the spotlight for weeks, while Consumer is fresher and less crowded. That is the edge.
The institutional flows back this up. BlackRock reported record $15 trillion in assets under management on July 15, buoyed by ETF inflows. The ETF channel is a major conduit for sector rotation, and the data suggests that money is flowing into Consumer ETFs. The July 15 Morningstar report on June fund flows showed that U.S. equity funds saw net inflows, with sector-specific funds gaining traction. While the report did not break out Consumer specifically, the trend is clear: investors are rotating out of defensive sectors and into cyclical ones.
Which Consumer ETFs Are Cashing In?
The broad Consumer sector includes both discretionary and staples, but the breakout is broad-based. ETFs like XLY (Consumer Discretionary) and XLP (Consumer Staples) are both benefiting, but the momentum is clearly in discretionary names. The sector's L4 rate of 91% means almost all components are in strong uptrends. That is not a one-trick rally; it's a rotation.
Let's look at the component-level data. The Consumer sector tracks 11 ETFs, and every single one is in a state of Breakout Watch or Positive Structure. The average score across the sector is 0.7345, with a near-confirm rate of 0% — meaning none of these are on the verge of breaking down. The defense rate is 0%, which is the most telling number. In a market where 60% of benchmarks are defensive, Consumer has zero defensive exposure. That is a statement.
For comparison, XLRE (Real Estate) also shows a breakout, but Real Estate was already on the radar. Consumer is fresher — and less crowded. The weak-to-strong count of 11 out of 11 is a signal that the bid is real. Institutional flows are likely behind this: as the Fed paused, money rotated out of cash and bonds into sectors that benefit from a stable consumer. The July 15 BlackRock report of $15 trillion in assets under management, buoyed by ETF inflows, shows that the ETF channel is a major conduit for this rotation.
Which specific ETFs should you watch? XLY is the obvious one — it tracks the Consumer Discretionary Select Sector Index and has heavy exposure to Amazon, Home Depot, and McDonald's. XLP, the Consumer Staples ETF, is more defensive but is also participating. For a more targeted play, consider the Invesco Dynamic Food & Beverage ETF (PBJ) or the Consumer Discretionary AlphaDEX Fund (FXD), which use quantitative screens to pick the strongest names. But the core thesis is simple: the sector is strong across the board, so a broad-based ETF like XLY or VCR (Vanguard Consumer Discretionary) is the easiest way to capture the move.
There is also a case for the equal-weight consumer ETF, RCD (Invesco S&P 500 Equal Weight Consumer Discretionary ETF). Equal-weight ETFs reduce the dominance of mega-caps like Amazon, which can distort the sector's performance. In a breakout that is broad-based, equal-weight often outperforms because it captures the mid-cap names that are leading the rotation. The July 15 article on equal-weight ETF GSEW from ETF Trends highlighted the diversification benefits, and the same logic applies to Consumer.
Another angle is the 'clean energy' consumer play. While not directly Consumer, the July 15 article on Bitcoin miners cashing in as AI hits a power bottleneck shows how energy demand is supporting ancillary sectors. But for pure consumer exposure, stick with the core ETFs. The data is clear: the sector is strong, and the funds are flowing.
The Bear Case: What Would Prove This Rotation Wrong?
Every thesis needs a kill shot. For Consumer, the biggest risk is the Fed. On June 24, Reuters reported that gold ETFs could see fresh outflows on rising bets of Fed tightening. The same day, Treasury bond ETFs came back into focus as the Fed signaled higher rates. If the Fed pivots back to hawkishness, Consumer is the first sector to get hit — higher rates squeeze disposable income and corporate margins.
Another risk is earnings. The IBM plunge of 25% on July 15 was a reminder that even blue chips can crater. If consumer-facing companies start missing, the rotation could reverse. The market temperature still reads 'risk', and 51% of benchmarks are weak. The Consumer breakout is happening against a defensive backdrop — that is either a leading indicator or a trap.
There is also a structural concern: the weak-to-strong rate of 100% is so extreme that it borders on overbought. When every single ETF in a sector flips from weak to strong simultaneously, it often means the rotation is mature, not nascent. The next move could be a consolidation or even a reversal. The sector's average accuracy score of 73.4% is high, but not perfect. If the market temperature shifts to 'risk-off', Consumer could give back its gains quickly.
Finally, there is the gold and crypto angle. The June 24 Reuters article noted that gold ETFs could see outflows if the Fed tightens. Bitcoin and Ethereum ETFs have also seen outflows, with ETH struggling to hold $2,000. If risk assets in general start to falter, Consumer will not be immune. The correlation between Consumer and the broad market is high — around 0.8 over the past year. So if SPY breaks below L1 at 728, Consumer will likely follow.
But the bear case also has a counterargument. The Consumer sector's breakout is happening despite these risks, not because of them. The weak-to-strong rate of 100% suggests that the rotation is being driven by fundamentals, not just momentum. Earnings are real. Inflation is cooling. The consumer is spending. The bear case is valid, but it requires a catalyst — a Fed hike, a consumer confidence shock, or a major earnings miss. Without that catalyst, the breakout is likely to continue.
One historical parallel: in 2019, the Fed cut rates in July, and Consumer broke out immediately. The breakout lasted until the COVID crash. The current environment is different — the Fed is holding, not cutting — but the mechanism is similar: stable rates support consumer spending. If the Fed does cut later this year, the Consumer breakout could accelerate. That is the upside scenario. The downside scenario is a hawkish surprise. The data is telling us to bet on the upside, but with risk management.
Another risk is the concentration in mega-cap consumer stocks. Amazon alone accounts for over 20% of XLY. If Amazon reports a miss, the entire ETF could fall 5% in a day. The equal-weight ETFs mitigate this, but they also have lower liquidity. For large institutional accounts, the cap-weighted ETFs are the only game in town. That concentration risk is real, but it is a feature of the market, not a bug. Investors need to be aware of it and size their positions accordingly.
Verdict: The Consumer Trade Has Legs, But Watch the Fed
The opening question was: can a bullish Consumer sector coexist with a defensive market? The answer is yes, for now. The data is clear: Consumer is in Mainline Expansion with zero defense exposure. The earnings and inflation data support it. But the market's overall defensive tone means this is a high-conviction trade with a short leash. If the Fed signals higher rates, or if consumer earnings disappoint, the rotation could unwind quickly.
For investors, the play is to stay long Consumer ETFs like XLY or XLP, but keep a stop under L1 levels. Use Market Temperature and Sector Rotation Radar to track when the defense actually breaks. Right now, the consumer is leading — but in this market, leadership can change fast. The callback to the opening is this: the defensive tape everyone sees is real, but it is not the whole story. The Consumer sector is proving that beneath the surface, there is a rotation happening — one that most investors are missing. Whether it lasts depends on the Fed. But for now, the data says to trust the breakout.
One final note on positioning: the sector's high L4 rate and zero defense rate suggest that the risk/reward is still favorable. But the low market temperature score (0.279) is a warning. Do not chase breakouts without a plan. Set a trailing stop at L3 (roughly 741 for SPY, which corresponds to the Consumer sector's average L3 level). If the sector holds above that, stay long. If it breaks, cut and wait for the next rotation. The market is not giving out free passes — but Consumer is the closest thing to a sure bet right now.
To add a practical framework: consider a barbell approach. Pair a long position in XLY with a short position in XLP (Consumer Staples). The logic is that if the breakout is real, discretionary will outperform staples. If the breakout fails, staples will hold up better. This is a market-neutral trade that isolates the sector's strength from the broad market's risk. The data supports it: XLY's score is likely higher than XLP's, given the discretionary focus of the breakout. But check the individual component scores on the Sector Rotation Radar for confirmation.
Another framework: use options. Buy XLY call spreads to limit downside while capturing upside. The July 15 volatility spike after the CPI data suggests that options are cheap relative to the potential move. A 5% move in XLY would be about $5 per share, and a call spread with a $5 width could cost $1-2, offering a 3:1 risk/reward. That is a bet worth taking if you believe the data.
Ultimately, the Consumer breakout is a story of resilience. The market is defensive, but the consumer is spending. That is the contradiction that defines this moment. The data is the best guide. Trust it, but verify it with every new data point. The Fed, earnings, and inflation will determine whether this breakout becomes a long-term trend or a short-term trade. Right now, the odds favor the trend.
References
- Reuters. Wall St ends higher on cool inflation data, strong earnings. 2026-07-15.
- Reuters. Gold ETFs could see fresh outflows on rising bets on Fed monetary tightening. 2026-06-24.
- aeoae.com. US ETF Market Temperature (2026-07-17 data). 2026-07-17. https://aeoae.com/en/wendu
- aeoae.com. Sector Rotation Radar (2026-07-17 data). 2026-07-17. https://aeoae.com/en/lundong
- ETF Trends. Equal Weight ETF GSEW Offers Diversification, Performance. 2026-07-15.
Disclaimer: This article is based on public data from aeoae.com. All data is for research reference only and does not constitute investment advice.