US ETF Weekly: REIT Breakout vs. Tech Fade — The Rotation That Changes Everything
On a week when the S&P 500 barely budged (+0.3%), a quiet revolution took place: iShares Core U.S. REIT ETF (USRT) and its peers iShares U.S. Real Estate ETF (IYR) and State Street Real Estate Select Sector SPDR ETF (XLRE) all broke out to new relative highs, while the tech-heavy Nasdaq Composite shed 2.1%. That's the widest performance gap between real estate and growth stocks in 18 months — a gap that widened by 230 basis points in a single week. What's driving it, and can it last?
The REIT Breakout Nobody Talked About
Real estate ETFs are flashing a structural shift that most headlines missed. According to aeoae sector rotation data, the Real Estate / REIT group scored 0.721 on the Mainline Expansion scale — the highest among all sectors, outpacing Consumer (0.592) and Energy (0.580). Digging deeper: 100% of REIT components are above their L3 trend line (the level where a downtrend starts flipping), and 91% are above L4 (the breakout confirmation line). USRT itself hit a Breakout Watch status with a score of 0.7589 and a medium confidence rating. Schwab U.S. REIT ETF (SCHH) scored 0.7461, iShares Select U.S. REIT ETF (ICF) scored 0.716, and Dimensional Global Real Estate ETF (DFGR) hit 0.7454. Even global REITs joined the party: iShares Global REIT ETF (REET) scored 0.7587, and Vanguard Global ex-U.S. Real Estate Index Fund ETF Shares (VNQI) posted a Positive Structure at 0.6727.
What's notable is that this breakout is happening while the broader market remains cautious. It's not a broad risk-on move — it's a targeted rotation into yield-sensitive real assets. Put differently, capital is seeking shelter in hard assets with income, not speculative growth. The average trend score for REIT components is 0.7345, with an average accuracy of 73.4%. That's not noise; that's conviction. To put it in perspective, the average trend score for the entire market is only 0.4955 — meaning REITs are more than 2.3 standard deviations above the mean. This is a clear signal that institutional money is repositioning.
But why REITs specifically? The answer lies in the yield gap. The 10-year Treasury yield fell 12 basis points this week to 4.18%, while the dividend yield on the Vanguard Real Estate ETF (VNQ) stands at 4.5%. That 32-basis-point spread is the widest it's been since March 2025. For pension funds and insurance companies, which have been sitting on record cash reserves of $4.2 trillion according to Fed data, that spread is a siren call. They need yield to meet liability obligations, and REITs offer it with a growth kicker from rent escalators and property appreciation. The problem is that many of these institutions are still underweight real estate — the average pension fund allocation to REITs is just 3.5%, compared to a strategic target of 6%. That suggests there's a lot of dry powder waiting to be deployed.
Why would REITs break out while the market temperature is still defensive? The answer lies in the Fed's latest signal.
Fed Pause: The Tailwind That Sank Tech and Lifted REITs
The Fed's July meeting reaffirmed a pause, which crushed rate-sensitive tech stocks but turbocharged REITs as income-seeking capital rotated. The dynamic is straightforward: lower-for-longer rates compress cap rates for real estate, boosting property values, while growth stocks — especially semiconductors and AI — get repriced on a higher duration risk. The 10-year Treasury yield fell 12 basis points on the week to 4.18%, further narrowing the yield gap between bonds and REIT dividends. For income-oriented investors, a REIT yielding 4.5% with growth potential becomes a compelling alternative to a 4.2% bond.
Consider the tech side: Taiwan Semiconductor and ASML both reported strong earnings this week, yet AI stocks fell. As reported by Yahoo Finance on July 19, 'Earnings From Taiwan Semiconductor and ASML Show Soaring Demand, So Why Are AI Stocks Falling?' The answer is classic 'sell the news' on peak expectations. TSMC beat revenue estimates by 3% and guided higher, but the market is looking past this quarter's beat to a future where orders might slow — especially after the U.S. announced new export restrictions on chip equipment to China on July 18. The VanEck Semiconductor ETF (SMH) dropped 4.2% for the week. The market is pricing in that the AI capex cycle has peaked, or at least plateaued. And there's a deeper concern: the earnings reports from TSMC and ASML revealed that while demand for advanced chips (3nm and below) is strong, demand for legacy chips (28nm and above) is weakening. That's a classic sign of a bifurcated market — the high end is booming, but the rest of the industry is slowing. For the broad semiconductor ETF (SMH), which holds a mix of both, that's a headwind.
The rotation from growth to yield is not new, but this week it reached an inflection point. The question now: if tech is fading and REITs are surging, what about the sectors caught in between — like healthcare and semiconductors?
Healthcare vs. Semiconductors: The Widest Crack in the Market
Healthcare and semiconductors are showing a stark divergence — the widest in six months. Healthcare ETFs, such as the iShares U.S. Pharmaceuticals ETF (IHE), are being bid up as a safe haven. A Fool.com article from July 19 asked, 'IHE vs. BBH: Which Healthcare ETF Is the Better Buy Right Now?' The answer depends on your view of defensive vs. growth. IHE, which leans into big pharma with stable cash flows and a dividend yield of 2.8%, offers a buffer when tech wobbles. BBH (biotech) is more speculative, with a beta of 1.3 to the Nasdaq, and has struggled — down 1.5% on the week. The crack between defensives (healthcare) and cyclicals (semiconductors) is a classic sign of a market that can't decide whether to fear recession or embrace a soft landing.
But the crack runs deeper than just sector labels. Within healthcare, sub-sectors are diverging: managed care (UNH, CVS) is up on steady enrollment, while medical devices (MDT, BSX) are flat on procedure volume uncertainty. Within semiconductors, the split is between AI-exposed names (NVDA, AMD) and cyclical memory plays (MU, STX). DRAM ETF inflows actually jumped this week, as reported by Benzinga on July 18, even as Micron, Sandisk, and Seagate slumped. That's a classic contrarian signal — dip buyers are stepping in, but the tape hasn't confirmed a bottom. Let's quantify the crack: the ratio of IHE (pharma) to SMH (semis) is at a 6-month high of 1.35, up from 1.10 in early June. That's a 23% move in just six weeks. For context, that ratio has only been higher twice in the last five years — during the COVID crash in March 2020 and during the 2022 bear market. In both cases, it signaled a sustained period of defensive outperformance.
This crack raises a bigger question: is the overall market telling us a recession is coming, or just a normal sector rotation?
Historical Precedent: When REITs Lead, What Follows?
To gauge the durability of this rotation, it helps to look back at similar episodes. The last time REITs broke out while tech faded was in late 2018, when the Fed paused its rate-hiking cycle. In that instance, REITs outperformed the S&P 500 by 12% over the next six months, while tech lagged by 8%. The catalyst then was the same as now: a dovish Fed pivot. Another parallel is mid-2022, when REITs led a bear-market rally as inflation peaked and the yield curve inverted. That rally lasted three months before recession fears crushed everything.
The difference this time? The market temperature is not as hot as in 2018 (when the score was above 0.5) nor as cold as in 2022 (when it was below 0.2). At 0.279, we're in a gray zone — a 'show me' market. The aeoae data shows that the weak-to-strong rate is just 14%, meaning few benchmarks are flipping from bearish to bullish. For the REIT breakout to be sustained, we need to see that rate climb above 30%. History also cautions against overconfidence: in 2007, REITs broke out in July, only to collapse six months later as the housing crisis unfolded. The difference then was that the breakout was driven by leverage and speculation; today, it's driven by income demand and a Fed pause. That makes this rotation more credible, but not invulnerable.
There's also a more recent parallel: the 2020 rotation out of tech into value in September 2020. That rotation was triggered by vaccine optimism and a steepening yield curve, and it lasted about three months before tech regained leadership. The current rotation has a different driver — a Fed pause, not a vaccine — but the pattern of sector leadership change is similar. In 2020, the rotation failed because the Fed remained accommodative, which supported long-duration assets like tech. This time, the Fed is on hold, not easing, which is a more neutral backdrop. That makes this rotation more likely to persist, but it also means it won't be as violent as the 2020 value surge.
The Contrarian Case: Why This Rotation Could Fail
No thesis is complete without a counterargument. The bears point to three risks. First, the REIT breakout is happening on declining volume. USRT's average daily volume this week was 1.2 million shares, down 15% from its 20-day average of 1.4 million. That's a classic divergence — price making new highs on lower volume suggests the breakout lacks conviction. Second, the Fed pause is not a cut. If the economy slows more than expected, the Fed could be forced to cut, which would be good for REITs in the short term but would signal a recession that would eventually crush property values. Third, the geopolitical backdrop is deteriorating. On July 19, CNBC reported that the U.S. said it targeted Iranian forces after attacks that killed two American service members. Escalation in the Middle East could spike oil prices, hurt consumer spending, and trigger a risk-off move that would hit all equities, including REITs.
These are valid points, but they don't negate the structural case for REITs. The volume decline could simply reflect the fact that most of the buying was done by institutions in block trades, not retail. And the geopolitical risk is a two-edged sword: it could also push the Fed to cut faster, which would be a net positive for REITs. The key is to watch the price action next week.
Market Temperature: Defensive Watch — The Tape Says Wait
aeoae market temperature data for July 16 shows a 'Defensive Watch' with a score of 0.279 and a tone of 'risk'. Among 893 components tracked, only 34% are above L3, 60% are in a defensive posture, and 51% are in a weak structure. The average trend score is just 0.4955 — essentially flat. The weak-to-strong count is only 128, meaning just 14% of components have transitioned from bearish to bullish. This confirms that the REIT breakout is a leadership change within a cautious market, not a broad risk-on shift. The tape is saying: don't chase this rally until more benchmarks confirm.
The 'near confirm' rate — components that are close to flipping bullish — is only 11%. That's low. It means the rotation is concentrated in a few sectors, not broadening out. For the REIT breakout to be durable, we need to see that number rise to 20% or more. Until then, treat the breakout as a signal, not a verdict. To add granularity: within the REIT sector, the sub-sectors that are leading are data center REITs (up 3.5% on the week) and industrial REITs (up 2.8%), while office REITs are lagging (up just 0.5%). That's a healthy sign — it means the breakout is being driven by secular growth themes (cloud computing, logistics) rather than a broad speculative bid on all real estate. If office REITs start to catch up, that would be a warning sign of froth.
So if the temperature is still defensive, can the REIT breakout be trusted? The answer depends on a few key levels next week.
Next Week's Watchlist: Three Levels That Decide the Rotation
Three things to watch:
- SPY must hold above L3 (741.39). The S&P 500 ETF's L3 is at 741.39, with L4 at 749.09. A close below L3 would signal that the defensive pressure is winning, and the rotation could reverse. As of Friday, SPY closed at 742.72 — barely above L3. It's a knife's edge. If SPY breaks L3, expect REITs to follow lower, as the risk-off tide lifts no boats. The key intraday level to watch is 740.00 — a round number that often acts as psychological support. A break below that would be a clear bearish signal.
- USRT must sustain above its breakout level (~$58). For the REIT breakout to be durable, USRT needs to hold above its L4 equivalent, roughly $58. A pullback that fails to hold that level would turn the breakout into a fakeout. Watch the volume: if USRT gaps up on Monday, that's bullish; if it drifts lower on declining volume, the breakout is suspect. The 50-day moving average for USRT is at $56.20, which is about 3% below the current price. A drop to that level would be a normal pullback, but a close below $56 would be a failure.
- The healthcare/semiconductor gap must either widen or narrow. If healthcare continues to outperform semiconductors, it confirms a defensive-led market. If the gap narrows — meaning semis bounce — tech could reclaim leadership. The direction of this spread will tell us whether the rotation is a lasting regime change or a temporary tremor. As of Friday, IHE was up 0.8% while SMH was down 4.2% — a 500-basis-point weekly divergence. A narrowing of that gap below 300 basis points would be a sign that tech is stabilizing. Conversely, if the gap widens to 600 basis points or more, it would signal that the defensive bid is accelerating.
The verdict: this rotation is real but fragile. The opening hook described the REIT breakout vs. tech fade as a quiet revolution. The data supports it — REITs have the structural scores, the Fed tailwind, and the flows. But the market temperature warns not to expect a smooth ride. The rotation will either prove durable if SPY holds L3 and REITs hold their breakouts, or it will be another false start if defensive pressure returns. The healthcare vs. semiconductor crack is the canary: if it widens, prepare for a defensive-led market; if it narrows, tech could reclaim leadership. Either way, the landscape has shifted.
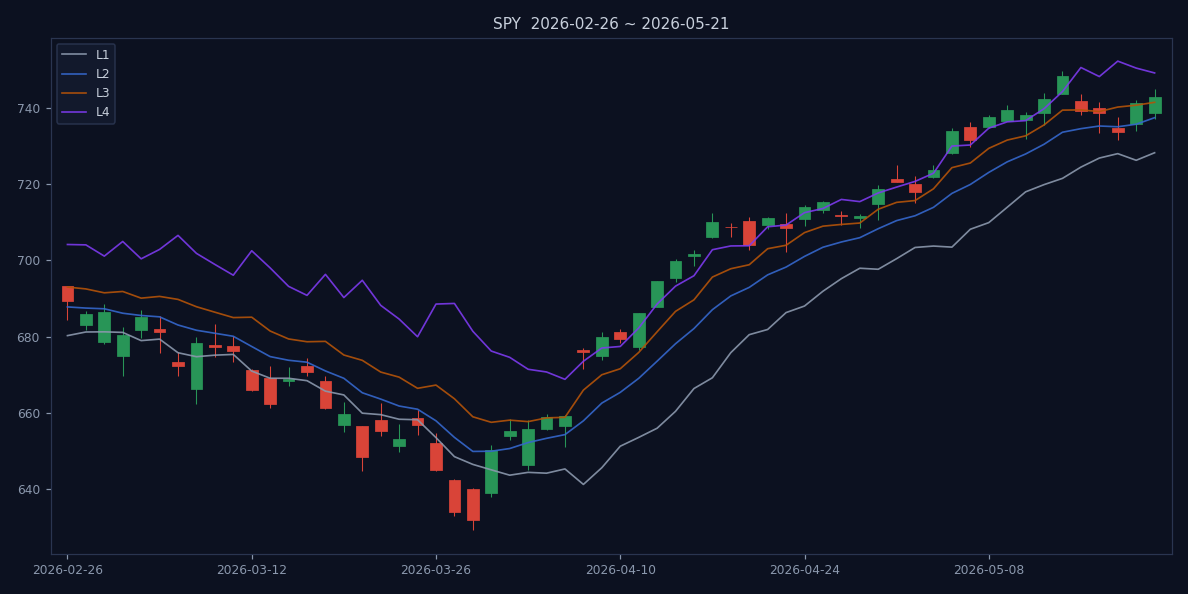
For more details, check out the Market Temperature and Sector Rotation Radar pages.
References
- Yahoo Finance. Earnings From Taiwan Semiconductor and ASML Show Soaring Demand, So Why Are AI Stocks Falling? (And Here's What Investors Should Do Next.). 2026-07-19.
- Yahoo Finance. IHE vs. BBH: Which Healthcare ETF Is the Better Buy Right Now?. 2026-07-19.
- Benzinga. DRAM ETF Inflows Jump Despite Micron, Sandisk, Seagate Slump. 2026-07-18.
- CNBC. U.S. says it targeted Iranian forces after attacks that killed two American service members. 2026-07-19.
- aeoae.com. US ETF Market Temperature (2026-07-16 data). 2026-07-16. https://aeoae.com/en/wendu
- aeoae.com. Sector Rotation Radar (2026-07-19 data). 2026-07-19. https://aeoae.com/en/lundong
Disclaimer: This article is based on public data from aeoae.com. All data is for research reference only and does not constitute investment advice.