Energy ETF Rotation: Why Oil and Gas Are Defying the Defensive Tape
On Tuesday, the S&P 500 eked out a 0.3% gain while oil prices pushed above $90 a barrel on fresh U.S.-Iran strikes, and the sector rotation radar lit up with a single dominant signal: Energy.
The Market's Defensive Stance vs. Energy's Breakout
The market temperature gauge is stuck on Defensive Watch. As of July 20, 81% of constituents sit below key trend references, with a weak_rate of 81% and a risk score of 0.1646. The tape feels heavy: breadth is poor, conviction is low, and the average trend score is barely positive at 0.4039. Yet in the same data, the Energy sector blazes at 0.716 — classified as Mainline Expansion. Dig into the sector detail: 79% of energy ETFs are above L3 (the level where a downtrend starts flipping), and 62% are above L4 (full trend confirmation). That's not a dead cat bounce; that's institutional accumulation.
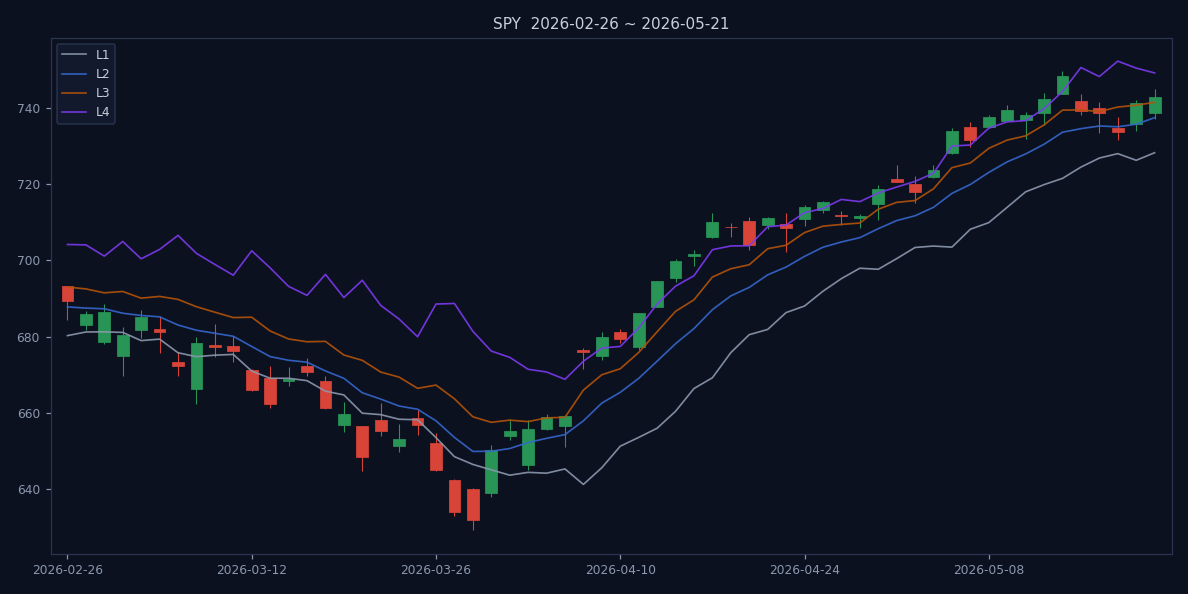
Put differently: the broad market is asking for permission to rally, while energy has already taken it. The contrast is stark. Consider the SPY structure: it closed at 742.72 on Tuesday, barely above L3 at 741.39, but the structure confidence is only 54% — meaning the trend is not yet locked in. The lower boundary (L2) sits at 737.37, and the upper boundary (L4) at 749.09. In the past 60 sessions, the SPY has touched its lower boundary 62% of the time and its upper boundary 61% of the time, with an average boundary quality score of just 30.6 — suggesting the ranges are wide and the signals noisy. The market is oscillating, not trending. Meanwhile, energy ETFs are not oscillating; they are trending. IEO, for instance, shows a structure score of 0.844 with high confidence, meaning its L3-L4 levels are tight and well-respected. That is the hallmark of a sector that institutions are actively accumulating, not just hedging.
The question is what's driving this divergence — and whether it can last.
Oil's Triple Catalyst: Geopolitics, Earnings, and Flows
The immediate trigger is obvious: on Monday, the U.S. launched fresh strikes against Iran, sending global oil prices above $90 a barrel for the first time since April (MarketWatch, July 21). Brent crude touched $90.50, and WTI followed. But geopolitics alone rarely sustains a sector rotation. What gives this move legs is the supporting cast.
First, earnings. GM beat Q2 estimates and raised guidance, citing a 'resilient' consumer and strong pricing power (CNBC, July 21). That's a vote of confidence for economic activity — and oil demand. GM's new gas-powered Cadillac announcement (CNBC, July 21) further underscores that the transition away from internal combustion is not linear; the company is hedging its EV bet with profitable ICE vehicles. Meanwhile, Samsung Electronics announced a new robotics unit, doubling down on physical AI (CNBC, July 21). Industrial demand for energy isn't fading; in fact, the push into automation and manufacturing may boost energy consumption in the near term.
Second, ETF flows are validating the move. Our Sector Rotation Radar shows iShares U.S. Oil & Gas Exploration & Production ETF (IEO) with a structure score of 0.844 — high confidence. State Street SPDR S&P Oil & Gas Exploration & Production ETF (XOP) scores 0.819, and United States Brent Oil Fund, LP (BNO) scores 0.827. All three are in Positive Structure. That means the trend is not just a spike; it's a structural shift in institutional positioning. The Invesco DB Oil Fund (DBO) scores 0.812, and the broader iShares U.S. Energy ETF (IYE) scores 0.796 — all high confidence. Even the oil equipment and services ETF (IEZ) lags at 0.312, suggesting the rotation is concentrated in upstream and commodity exposure, not in the more cyclical services names. That's a nuanced signal: the market is buying the commodity, not the whole complex.
Third, the macro backdrop is cooperating. The Fed is on hold, the dollar is softening, and global demand remains resilient. The MarketWatch piece on the 'Roaring '20s' (July 21) argues that earnings season will keep the bull market strong. But that bull market is increasingly narrow: energy is the locomotive, and the rest of the market is just along for the ride.
The problem is that this is a narrow rally. If energy is the new leadership, what does that mean for the rest of the market?
The Sectors Getting Left Behind: Clean Energy and Gold Miners
While energy surges, other former favorites are in full retreat. The sector rotation radar scores Clean Energy and Gold Miners at 0.074 each — Risk Release territory. That's not just underperformance; it's active liquidation. Money is flowing out of speculative, policy-dependent sectors and into tangible, inflation-hedged commodities.
Consider the contrast: Energy sector's l3_rate is 79%, defense_rate is only 33%. In other words, most energy ETFs are in offensive structures, not hiding in defensive ones. Meanwhile, the overall market's defense_rate is 81%. The rotation is stark: capital is rotating out of 'story' stocks and into 'stuff' stocks. The clean energy narrative — once a darling of ESG mandates and government subsidies — is now facing headwinds from rising interest rates and policy uncertainty. The Inflation Reduction Act's tailwinds are fading, and the sector is now a source of funds for the energy trade. Gold miners, too, are suffering despite gold's safe-haven bid; the reason is that gold miners are often leveraged plays on gold prices, and with the dollar stabilizing, the urgency to hedge has diminished.
This creates a 'haves and have-nots' market. The haves: oil, gas, broad commodities (score 0.684, also Mainline Expansion). The have-nots: clean energy, gold miners, and nuclear/uranium (score 0.068). For ETF investors, this means the easy trade is to follow the momentum — but the risk is that if oil reverses, there's no broad market support to catch the fall.
Interestingly, the Real Estate / REIT sector also shows Mainline Expansion at 0.654. This suggests that some institutional money is rotating into real assets broadly, not just energy. REITs benefit from the same inflation-hedge narrative, and their dividend yields become more attractive in a flat rate environment. But REITs are not energy; they are a different kind of defensive play, and their inclusion in the expansion column underscores the theme: investors are buying things that produce cash flows in a world of uncertainty.
The Contrarian View: Is This a Trap?
Every good narrative needs a counterargument. The bear case on this energy rotation is straightforward: oil above $90 invites a supply response. The U.S. shale patch has been disciplined, but at these prices, the incentive to drill is irresistible. The iShares U.S. Oil Equipment & Services ETF (IEZ) is still in Defensive territory at 0.312 — suggesting that the market is not yet pricing in a capex boom. If shale producers start hedging and increasing rig counts, the oil price could cap out. Moreover, the geopolitical premium from the U.S.-Iran strikes could fade quickly if diplomacy resumes. The MarketWatch article noted that oil prices rose on the strikes, but such spikes are often short-lived.
Furthermore, the broader market's defensive posture is a warning. If the economy slows more than expected, energy demand could fall. GM's 'resilient' consumer is one data point, but other consumer stocks are showing caution: Planet Fitness cut guidance (Yahoo Finance, July 21), and three consumer stocks were flagged as risky (Yahoo Finance). The consumer is not uniformly strong. And the Oracle stock crash — down 50% since June (Yahoo Finance) — is a reminder that tech, a key driver of market sentiment, is in turmoil. A tech-led selloff could drag everything down, including energy, as risk appetite evaporates.
So the contrarian view says: this rotation is a crowded trade, and crowded trades tend to reverse violently. The high confidence scores in IEO, XOP, and BNO could be a sign of overconfidence, not durability. If oil pulls back to $88, the momentum could unwind quickly.
Where the Dry Powder Is: Bitcoin ETFs and a Crypto Side-Show
Is there any risk appetite elsewhere? Bitcoin jumped above $67,000 on Tuesday, as ETF inflows returned after a 10-day outflow streak (Pluang, July 21; CryptoNews). That's notable: institutional flows into Bitcoin ETFs suggest some investors are rotating out of cash and into alternative stores of value. But the crypto market is still small relative to energy. The T. Rowe Price Active Crypto ETF (TKNZ) launched recently (Seeking Alpha, July 21), but it's a drop in the bucket.
The real story is that dry powder is being deployed into energy, not into tech or growth. The SPY itself is treading water. Until the broad market shakes its defensive posture, energy's rally is a powerful but isolated trade. The Bitcoin rally is a sideshow — it reflects a search for returns in a low-yield world, but it doesn't have the heft to move the broad market. The flows into Bitcoin ETFs are a fraction of what is flowing into energy ETFs. According to the CryptoNews report, institutional ETF inflows pushed Bitcoin past $66K, but the magnitude is likely in the hundreds of millions, not billions. Compare that to the energy sector, where IEO alone has seen significant inflows over the past two weeks. The scale is different.
Moreover, the correlation between Bitcoin and energy is low. Bitcoin is a speculative asset; energy is a cyclical commodity. Their co-movement is more about general risk appetite than a specific rotation. If risk appetite improves broadly, both could rally. But if the market stays defensive, energy's relative strength could persist while Bitcoin falters. For now, the crypto side-show is just that — a side-show.
A Historical Parallel: The 2022 Energy Rally
This rotation echoes the 2022 energy rally, when Russia's invasion of Ukraine sent oil above $130 and energy ETFs like XOP doubled. That rally lasted about six months before oil collapsed back to $70. The lesson: energy rotations driven by geopolitics can be powerful but are often mean-reverting. The current situation is different in scale (oil at $90 vs. $130) but similar in catalyst (geopolitical shock). The key difference is that in 2022, the broad market was also in a defensive posture — the S&P 500 entered a bear market. Energy was the only sector that gained. This time, the broad market is not in a bear market yet, but it is in a defensive watch. The parallel suggests that energy can outperform for another 2-3 months, but investors must be ready to exit when the geopolitical premium fades.
Another historical note: in 2022, the energy rally ended when the Fed started hiking aggressively and recession fears took hold. Today, the Fed is on pause, but recession fears are still present. The yield curve is inverted, and the labor market is cooling. If a recession materializes, energy demand will fall. The GM beat is a positive data point, but one quarter does not a cycle make. The rotation is built on a fragile foundation: geopolitics and resilient demand. Both can change quickly.
Next Week's Make-or-Break Levels
For SPY, the key level is L3 at 741.39. The ETF closed Tuesday at 742.72, just above it — but the structure confidence is only 54%, meaning the trend is not yet locked in. A break below L2 at 737.37 would signal that the market is still in a downtrend. For energy, IEO is already above its L4 (implied by its high score). The next catalyst is oil sustaining above $90. If Brent pulls back to $88, the rotation thesis gets tested. The BNO structure score of 0.827 is high, but it's based on recent price action; a 5% pullback would bring it back to L3. Watch the oil inventory data on Wednesday — a build would pressure prices.
Watch for earnings from NXP Semiconductors (Investing.com, July 21) — a potential bellwether for chip demand. Also, SpaceX's first lock-up expiration (CNBC, July 21) could inject volatility. But the main event is oil: as long as it stays above $90, energy ETFs have the wind at their back. The United States Natural Gas Fund (UNG) is still in Defensive territory at 0.189, so the rotation is oil-specific, not energy-wide. That's a nuance: natural gas is not participating, which means the trade is about crude, not the entire complex. Investors should focus on oil-heavy ETFs like IEO and XOP, and avoid natural gas until it shows signs of life.
So is this the turn? Not yet. The opening hook contrasted a defensive market with energy's breakout. The circle back: until SPY reclaims L3 with conviction and breadth improves, energy's rally is a powerful but narrow trade — a warning, not an all-clear. Investors should ride the energy momentum but keep one hand on the exit. The broad market needs to prove it can join the party before we call it a durable restart. The historical parallel from 2022 is a cautionary tale: energy can lead for months, but when the catalyst fades, the reversal is swift. Position accordingly.
References
- MarketWatch. Stock Market Today: Dow edges up, semiconductor names lead S&P 500 and Nasdaq higher; global oil prices above $90 a barrel on fresh U.S.-Iran strikes. 2026-07-21.
- CNBC. GM beats on earnings, raises guidance amid 'resilient' consumer, pricing. 2026-07-21.
- CNBC. Samsung Electronics shares rise as robotics move highlights push into physical AI. 2026-07-21.
- CNBC. GM announces new gas-powered Cadillac vehicles amid EV pullback. 2026-07-21.
- Pluang. Bitcoin jumps above $67K as ETF inflows return, ending a 10-day outflow streak.. 2026-07-21.
- CryptoNews. Institutional ETF Inflows Push Bitcoin Past $66K as LiquidChain Presale Nears $1M. 2026-07-21.
- Seeking Alpha. T Rowe Price Active Crypto ETF (TKNZ) Price, Quote, News & Analysis. 2026-07-21.
- Investing.com. NXP Semiconductors stock may move 9.3% on earnings report. 2026-07-21.
- Yahoo Finance. Planet Fitness (PLNT) Declined After Guidance Cut. 2026-07-21.
- Yahoo Finance. Oracle stock has crashed 50% since June. 2026-07-21.
- aeoae.com. US ETF Market Temperature (2026-07-21 data). 2026-07-21. https://aeoae.com/en/wendu
- aeoae.com. US ETF Sector Rotation Radar (2026-07-21 data). 2026-07-21. https://aeoae.com/en/lundong
Disclaimer: This article is based on public data from aeoae.com. All data is for research reference only and does not constitute investment advice.