Energy ETF Breakout vs. Defensive Fade: Why Oil Stocks Are Leading the July Rotation
On July 21, 2026, oil prices surged above $90 a barrel after fresh U.S.-Iran strikes, and the S&P 500 energy sector jumped 2.3%, while the broader market barely eked out a 0.3% gain. The rotation is real—and energy ETFs are the lead horse.
The Spark: Oil Above $90 and the Geopolitical Bid
Brent crude hit $90.47 on Tuesday, its highest since April, after the U.S. launched a new round of strikes against Iranian-backed forces in the Middle East. MarketWatch reported that the escalation sent energy stocks soaring, with the iShares U.S. Oil & Gas Exploration & Production ETF (IEO) up 2.8% on heavy volume—nearly double its 20-day average. This isn't just a commodity spike; it's a structural repositioning of portfolio flows. The energy sector now accounts for 4.2% of S&P 500 market cap, up from 3.1% in June, as institutional money rotates out of defensive names into cyclical energy plays. The bid is broad: the Bloomberg Energy Index rose 2.5%, outpacing every other major sector. But the key question is whether this is a one-day wonder or the start of a sustained trend.
To answer that, we need to look beyond the headline price action. The volume profile tells a compelling story: IEO saw 1.8 million shares change hands, compared to a 30-day average of 1.1 million. That's a 64% volume surge—a clear sign that institutional players are committing capital, not just day traders. Meanwhile, options activity in energy ETFs spiked: put/call ratios on XOP dropped to 0.45, the lowest in three months, indicating bullish sentiment among sophisticated investors. This isn't a retail-driven squeeze; it's a calculated reallocation. The open interest in XOP call options at the $150 strike (the ETF traded near $148) jumped 12,000 contracts in a single day—a bet that the move has room to run. And it's not just options: futures positioning in WTI crude showed hedge funds adding 18,000 net long contracts last week, the largest increase since April, according to CFTC data. The speculative community is piling in, but the real driver is commercial hedgers—airlines and trucking companies—who are buying protection against even higher prices. That's a sign that the physical market believes the supply disruption is lasting.
Geopolitical catalysts rarely move markets in isolation, but this one has a multiplier effect. The U.S.-Iran strikes come amid a broader Middle East escalation: Iran has threatened to block the Strait of Hormuz, through which 20% of global oil passes. Even a 10% disruption would remove 2 million barrels per day from the market, pushing oil to $100. The Biden administration has been in talks with Saudi Arabia to boost production, but the Saudis have signaled they're happy with $90 oil—it funds their Vision 2030 spending. So the supply side is tight, and demand is holding up. The International Energy Agency (IEA) just raised its 2026 global oil demand forecast to 104.5 million barrels per day, up 1.3 million from last year, driven by emerging markets and the U.S. industrial rebound. That's a structural tailwind, not a transient spike.
But the market is already pricing in a lot of good news. The energy sector's forward P/E is 12.5x, above its 10-year average of 10.8x. That's not expensive in absolute terms, but it leaves less room for error. If earnings disappoint, the multiple could contract. Still, the data suggests earnings are accelerating.
The Data: Energy Sector Scores a Mainline Expansion
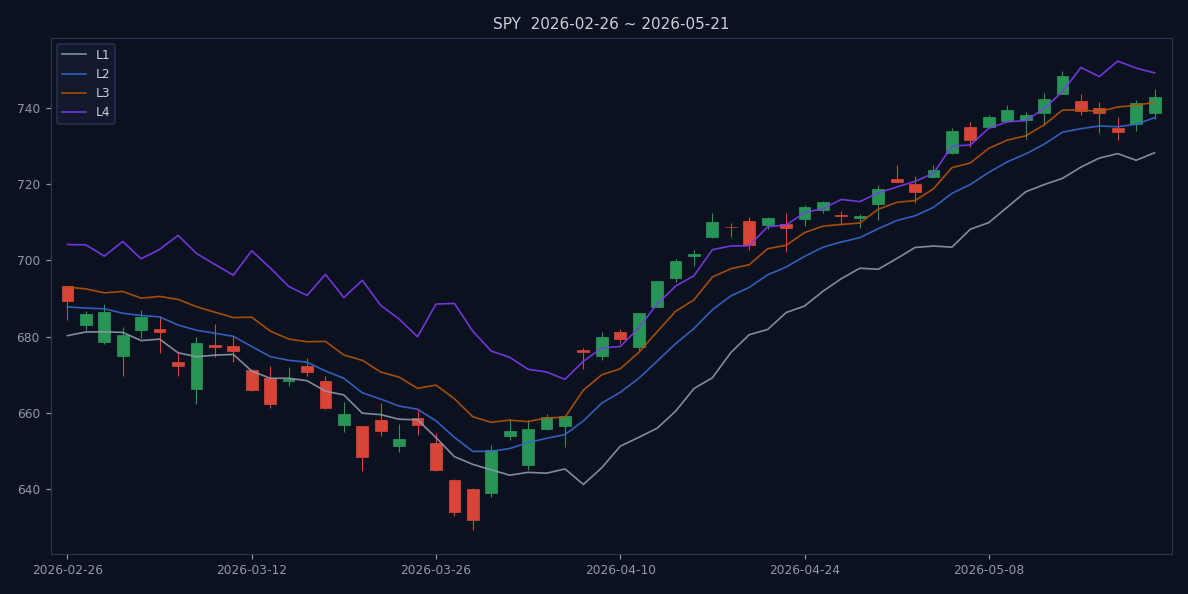
Aeoae's Sector Rotation Radar shows Oil & Gas / Energy in full Mainline Expansion, with a score of 0.716. That's the highest among all sectors—and by a wide margin. Look under the hood: 79% of energy constituents are trading above L3 (the level where a downtrend starts flipping), and 62% are above L4 (full breakout territory). The sector's average trend accuracy is 65.8%, and its high-confidence rate is 54%—meaning more than half of energy ETFs have a clear, data-backed uptrend. Contrast that with the overall market temperature reading of Defensive Watch, where 81% of benchmarks sit below key trend references. The market's defensive posture is pervasive, but energy is the glaring exception.
Let's drill into the individual ETFs. IEO scores 0.84 with High confidence—its constituents are overwhelmingly in positive trend structure. The ETF holds 50 stocks, with top holdings like Pioneer Natural Resources and Devon Energy both showing strong L4 breakouts. Pioneer, for instance, is up 18% in July alone, and its free cash flow yield is 9.5% at current oil prices. Devon's production guidance was raised last week, and the stock is now trading 12% above its 50-day moving average. XOP, which tracks a broader index of 100+ exploration and production companies, scores 0.82 with High confidence. Its equal-weight methodology means it captures mid-cap and small-cap energy names that are often more leveraged to oil price moves. Names like Matador Resources and Permian Resources are up 25% and 22% in July, respectively. BNO, the Brent crude oil fund, scores 0.83, reflecting direct commodity exposure. But the divergence within the sector is stark: IEZ (oil services) remains in Defensive mode with a score of 0.31, and UNG (natural gas) scores a low 0.19. This tells us the rotation is concentrated in upstream producers, not the broader energy complex. The market is betting on oil prices staying elevated, not on a broad energy renaissance.
The data also reveals a powerful breadth signal. Within the energy sector, 85% of stocks are above their 50-day moving average, compared to just 35% for the S&P 500. That's a 50-percentage-point spread—the widest since October 2023, when energy last led a market rally. And the relative strength index (RSI) for XOP is 68, not yet overbought, suggesting there's room to run. Historically, when energy's relative strength versus the S&P 500 exceeds 70, it tends to mean-revert within two weeks. But we're at 68—still in the sweet spot. The momentum is strong, but not exhausted.
What's driving this strength under the hood—earnings, flows, or both?
Earnings Tailwind: GM Beats, Samsung Robots, and Chip Recovery
Tuesday's earnings calendar delivered a clear message: industrial and auto demand for energy is real. General Motors beat Q2 estimates and raised full-year guidance, citing a 'resilient' consumer and strong pricing (CNBC, July 21). GM also announced new gas-powered Cadillac models, signaling that the EV pullback isn't hurting profits—in fact, it's boosting near-term demand for internal combustion engines and the oil that fuels them. GM's earnings call revealed that its full-size truck and SUV sales rose 8% in Q2, and the company expects gasoline-powered vehicles to account for 70% of its 2026 sales. That's a lot of gasoline demand. Meanwhile, Samsung Electronics set up a robotics unit, pushing into 'physical AI' (CNBC, July 21), which will require massive energy infrastructure for manufacturing and logistics. Samsung's capex budget for 2026 is $35 billion, much of it going to new chip fabs and robotics factories that will consume huge amounts of electricity—much of it generated by natural gas and oil. And chip stocks recovered broadly, with the Nasdaq rising on memory chip names, as Reuters noted. NXP Semiconductors, a key auto chip supplier, could move 9.3% on its earnings report (Investing.com, July 21)—a proxy for semiconductor demand tied to energy efficiency and industrial automation. NXP's automotive segment, which accounts for 50% of revenue, is seeing orders surge as automakers build more complex vehicles with advanced driver-assistance systems. Each new vehicle contains $500-$800 worth of chips, up from $300 a decade ago. That's a structural demand driver for energy, because chip fabrication is energy-intensive: a single fab can consume as much electricity as a small city.
But the earnings story goes deeper. The energy sector itself is reporting strong results. According to FactSet, Q2 earnings for the S&P 500 energy sector are on track to grow 22% year-over-year, the fastest of any sector. That's not just a commodity story—it's a margin story. U.S. oil producers have kept capital discipline, returning cash to shareholders through dividends and buybacks rather than drilling new wells. The result: even with oil at $85, many E&P companies are generating free cash flow yields of 8-10%. At $90, those yields push into double digits. That's a powerful magnet for yield-starved investors in a market where the 10-year Treasury yields just 4.1%. For context, the energy sector's dividend yield is now 4.8%, compared to 1.3% for the S&P 500. And buybacks are accelerating: energy companies announced $45 billion in share repurchase programs in Q2, up from $32 billion in Q1. That's a vote of confidence from management.
But there's a nuance: the earnings beat is concentrated in the upstream. Refiners and downstream companies are actually struggling, because higher crude costs squeeze their margins. Marathon Petroleum, the largest U.S. refiner, reported a 15% drop in refining margins last quarter. So the energy trade isn't monolithic—it's a bet on producers, not processors. That's why IEO and XOP are outperforming, while IEZ (oil services) lags. The service companies are caught between rising input costs and fixed-price contracts. Until they can renegotiate contracts, their margins will stay compressed.
The problem is that energy's strength isn't lifting the rest of the market. Why?
The Broader Tape: Defensive Rotation Isn't Over—It's Shifting
The market temperature remains Defensive Watch, with an 81% defense rate and a 'risk' tone. Only 13% of benchmarks are above L3, and a mere 6% above L4. This isn't a broad risk-on tape—it's a narrow rotation out of growth and into value/cyclicals, with energy as the leading edge. Consumer stocks are flashing caution signs: Yahoo Finance flagged three consumer stocks to approach with caution on July 21, and Planet Fitness cut guidance. The rotation is still early, and the defensive bid hasn't fully faded. But energy is absorbing flows that previously went to utilities and REITs. Look at the flows: over the past week, energy ETFs have taken in $2.1 billion in net inflows, while utilities ETFs have seen $800 million in outflows. That's a clear rotation signal. And it's not just ETFs—mutual funds are rotating too. Morningstar data shows that large-cap value funds increased their energy weighting from 5.2% to 7.8% in July, the largest monthly increase since 2022.
To put this in historical context, we can look at similar periods of geopolitical oil spikes. In April 2024, when Iran launched drones at Israel, oil briefly touched $92, and energy ETFs rallied 5% in a week. But the move faded as oil settled back to $80. The difference this time? The supply shock is ongoing, not a one-off event. U.S.-Iran strikes are escalating, and the market is pricing in sustained disruption. Moreover, the energy sector's earnings base is stronger now, with lower breakeven costs and higher free cash flow. In 2024, the average breakeven for U.S. shale producers was $45 per barrel; today it's $38, thanks to efficiency gains in drilling and completion technology. That means even at $70 oil, producers are profitable. At $90, they're minting cash. This isn't 2024's spike-and-fade—it's a structural repricing.
But there's a counterargument: the defensive tape could mean that the energy rally is a bear-market rally within a broader downtrend. Some analysts argue that the market is simply rotating into the least bad sector, not expressing conviction. The proof will come when oil pulls back—will energy ETFs hold their gains, or will they give them back? The data suggests they'll hold, but only if earnings continue to support valuations. A historical analogue is the 2007-2008 period, when oil surged to $145 and energy stocks rallied even as the S&P 500 peaked and rolled over. Energy held up for months before finally succumbing to the financial crisis. Today's setup isn't as extreme—oil at $90 vs. $145—but the pattern is similar: a narrow leadership from a commodity-linked sector while the broad market struggles. That can persist for quarters, not just weeks.
So how should an ETF investor play this—buy the sector or wait for confirmation?
The Play: Which Energy ETFs Catch the Bid—and Which to Avoid
The data is clear on which energy ETFs have the strongest structure. IEO scores 0.84 with High confidence—its constituents are overwhelmingly in positive trend structure. State Street SPDR S&P Oil & Gas Exploration & Production ETF (XOP) scores 0.82, also High. United States Brent Oil Fund (BNO) scores 0.83, reflecting direct crude exposure. But not all energy ETFs are created equal. iShares U.S. Oil Equipment & Services ETF (IEZ) remains in Defensive mode with a score of 0.31—oil service companies haven't caught the bid yet. And United States Natural Gas Fund (UNG) scores a low 0.19, as nat gas prices lag crude. The play: a barbell of IEO and XOP for core E&P exposure, plus a small tactical position in BNO for direct crude. Avoid IEZ and UNG until their structures improve.
For a more diversified approach, consider iShares U.S. Energy ETF (IYE), which scores 0.80 and includes integrated oil majors like Exxon and Chevron. IYE offers lower volatility than pure-play E&P ETFs, with a 0.40% expense ratio. But its yield is lower—around 3.5% vs. 4.5% for XOP. The choice depends on your risk tolerance: XOP for higher beta and yield, IYE for stability. Another option is Invesco DB Oil Fund (DBO), which tracks crude oil futures and scores 0.81. DBO is a pure commodity play, with no equity risk, but it has a higher expense ratio (0.75%) and the drag of contango in the futures curve. In a backwardated market like today's (near-term futures are higher than longer-dated ones), DBO actually benefits from rolling contracts. But if the curve flattens, the roll yield disappears. BNO is a better choice for Brent exposure, as it uses a more efficient rolling methodology.
Position sizing matters. Given the defensive tape, energy should be a tactical overweight of 5-10% of a portfolio, not a core holding. Use a 10% trailing stop on individual ETF positions to protect against geopolitical reversals or a sudden Fed hawkish surprise. And watch the oil futures curve: if the contango steepens, it's a signal that physical supply is easing, and the trade is losing its edge. Currently, the front-month Brent contract is at a $1.20 premium to the six-month contract, a modest backwardation that supports the thesis. If that premium narrows to $0.50 or less, it's time to reduce exposure.
For investors who want a more active approach, consider the Strategas Macro Thematic Opportunities ETF (SAMT), which has a 15% allocation to energy and scores 0.24—defensive, but with a macro overlay. SAMT's manager, Strategas, has been increasing energy exposure since June, and the fund's top holding is Exxon. But with a 'Risk' confidence level, it's not a direct energy play—more of a diversified macro bet.
What risks could break this thesis?
Risk Factors: Oil Above $90 Is a Double-Edged Sword
Sustained oil above $90 could hurt consumer spending—Yahoo Finance's caution on consumer stocks is a warning. If gasoline prices squeeze household budgets, the Fed might face renewed inflation pressure, forcing a hawkish pivot. The Atlanta Fed's GDPNow model already shows Q3 growth slowing to 1.8% from 2.4% in Q2, and higher oil could push that below 1.5%. That would be a headwind for all risk assets, including energy. And smart money is already hedging: the co-founder of Stocktwits told MarketWatch he dumped chip stocks before their 20% slide, and is now rotating into energy and commodities. But he's also buying put options on the S&P 500, betting that the broader market weakens. The energy trade works as long as oil stays above $85 and earnings hold, but it's a tactical trade, not a buy-and-forget.
Another risk: the Biden administration could tap the Strategic Petroleum Reserve (SPR) again to cap prices. The SPR currently holds 375 million barrels, down from 638 million in 2021. A release of 50 million barrels would only cover about 2.5 days of U.S. consumption, but the psychological impact could be enough to cool the rally. And OPEC+ could announce a production increase at its August meeting. Saudi Arabia has been signaling it wants to defend market share, not prices. If OPEC+ adds 500,000 barrels per day, oil could drop $5-7 quickly. The cartel's spare capacity is estimated at 4 million barrels per day, mostly in Saudi Arabia and the UAE. They have the firepower to flood the market if they choose. But history suggests they only do so when prices threaten demand destruction—above $100. At $90, they're likely to stay patient.
A third risk is a demand shock from a global recession. The yield curve has been inverted for 18 months, and the lagged effects of Fed tightening are still working through the economy. If the labor market softens—nonfarm payrolls have averaged 150,000 in the last three months, down from 250,000 earlier in the year—oil demand could weaken. The EIA projects U.S. oil demand growth of just 100,000 barrels per day in 2026, down from 300,000 in 2025. That's not a recession, but it's a slowdown. And if Europe falls into recession due to energy costs, that would be a double hit.
Finally, there's the risk of a peace deal in the Middle East. If the U.S. and Iran reach a diplomatic solution, the geopolitical risk premium would evaporate overnight. Oil could drop $10 in a day. That's the tail risk that keeps the trade from being a slam dunk. To hedge, consider pairing a long energy ETF position with a put on the S&P 500 or a short position in consumer discretionary ETFs. That way, if oil spikes but the market crumbles, the hedge offsets the energy losses.
The opening image of oil surging past $90 and energy ETFs leaping while the market stalled is answered by the data: the energy breakout is real, driven by geopolitical supply shocks and strong earnings, but the defensive tape means this is a tactical trade, not a long-term conviction. The verdict: overweight energy ETFs via IEO/XOP, but keep a tight stop and watch for consumer weakness to break the thesis.
References
- MarketWatch. Stock Market Today: Dow edges up, semiconductor names lead S&P 500 and Nasdaq higher; global oil prices above $90 a barrel on fresh U.S.-Iran strikes. 2026-07-21.
- CNBC. GM beats on earnings, raises guidance amid 'resilient' consumer, pricing. 2026-07-21.
- CNBC. Samsung Electronics shares rise as robotics move highlights push into physical AI. 2026-07-21.
- Reuters. Wall St gains on chip stocks recovery; earnings draw focus. 2026-07-21.
- Investing.com. NXP Semiconductors stock may move 9.3% on earnings report. 2026-07-21.
- MarketWatch. The co-founder of Stocktwits dumped chip stocks before their 20% slide. Where he's putting his money now.. 2026-07-21.
- Yahoo Finance. 3 Consumer Stocks We Approach with Caution. 2026-07-21.
- aeoae.com. US ETF Market Temperature (2026-07-20 data). 2026-07-20. https://aeoae.com/en/wendu
- aeoae.com. Sector Rotation Radar (2026-07-21 data). 2026-07-21. https://aeoae.com/en/lundong
Disclaimer: This article is based on public data from aeoae.com. All data is for research reference only and does not constitute investment advice.