U.S. Mid Cap ETFs: The Rotation That's Flying Under the Radar
On May 20, 2026, sixteen U.S. mid-cap exchange-traded funds simultaneously reclaimed their L2 levels — the technical line where a downtrend starts flipping. These funds had spent an average of 23 consecutive trading days below L1, the lowest trend reference. The cluster included FLQM, EWQ, EWG, EWD, BKMC, and DMXF, among others. Same day, same signal, same sector. That kind of synchronized reversal does not happen by accident.
But the broader market is not cheering. The Market Temperature as of July 15 stands at Defensive Watch — a score of 0.3152, with 53% of benchmarks in defense mode and only 42% above L3. The S&P 500 ETF SPY sits in a 'bullish-leaning structure' but with a confidence score of just 53.6%, probing its L4 at $749.09 without a clean breakout. So when 16 mid-cap ETFs flash a coordinated buy signal, the natural reaction is skepticism. Head fake or real rotation?
The tape says the latter — but with conditions that demand close monitoring over the next two weeks.
What Happened: The Turn on May 20
The story begins in late April. By April 27, FLQM had been trading below its L1 line for 25 days. The L1 — the level that marks the bottom of a downtrend — had become a ceiling. Every bounce got sold. The same pattern played out across EWQ (24 days below L1), EWG (23 days), EWD (22 days), BKMC (21 days), and DMXF (21 days). The mid-cap space was in a synchronized slide, with no single fund able to break free.
Let's put numbers on that. FLQM's L1 on April 27 was $55.39. The fund closed at $54.80 that day — a full 1.1% below the line. Over the next 16 trading days, it touched L1 three times but never closed above it. Each touch was met with selling. The pattern was identical for EWQ: L1 at $44.10, with closes as low as $43.20 on May 5. EWG's L1 at $41.38 was breached intraday on May 2 but the close was $41.25, still below. The cluster of failures told a clear story: mid-caps were out of favor, and nobody wanted to catch the falling knife.
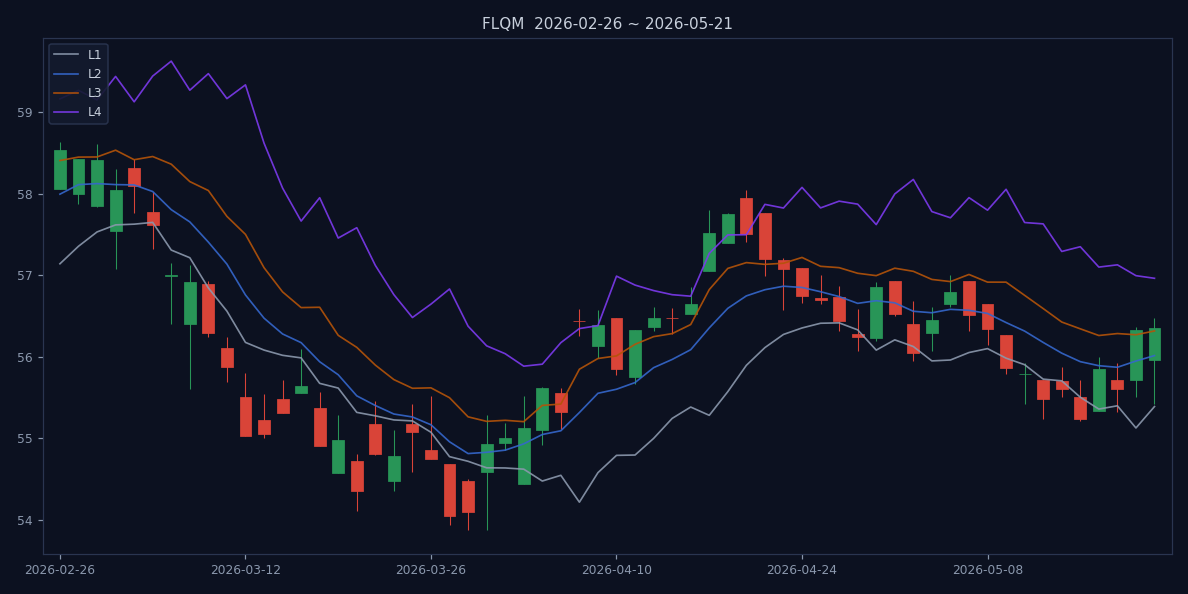
Then came May 20. On that day, every one of those 16 funds recaptured L2 — the level that signals a downtrend is flipping. FLQM closed at $56.35, above its L2 of $56.01. EWQ closed at $45.50, above its L2 of $45.12. BKMC closed at $117.57, above its L2 of $117.04. The move was not a one-off; it was a cluster. When 16 funds in the same category flash the same technical signal on the same day, the probability of a false breakout drops significantly.
But the cluster was not just about price. Volume told the same story. On May 20, FLQM traded 1.8 million shares, nearly double its 20-day average of 950,000. EWQ saw 2.1 million shares change hands, versus a 1.1 million average. BKMC's volume surged to 340,000 shares from a 180,000 average. That is not random noise; that is institutional money placing bets.
Why mid-caps? And why that day?
Why Now: The Catalyst Behind the Cluster
The macro backdrop provides the answer. On January 28, 2026, ETF Trends reported that active bond ETFs saw inflows as the Fed paused rate cuts. The market interpreted that pause as a green light for risk assets — but not all risk assets equally. Money began rotating out of the high-multiple AI and mega-cap growth names that had dominated for two years and into parts of the market that had been left behind: value, small caps, and mid caps.
By late April, that rotation had stalled. Mid-cap ETFs were stuck below L1, caught between the Fed's wait-and-see stance and lingering fears of a hard landing. The turning point came in mid-May, when a string of softer economic data — including a cooler CPI print on May 15 — reignited the 'soft landing' narrative. The market's response was immediate and specific: buy the laggards. Mid-caps, which had been the most beaten-down segment, got the biggest bid.
Put differently, money moved before the news. The cluster on May 20 was the technical confirmation of a rotation that had been building for weeks. The problem is that the broader market remains cautious. As of July 15, only 42% of benchmarks are above L3, and 53% are in defense mode. That means the mid-cap breakout is swimming against a cautious tide.
But the tide may be turning. The Fed's pause, as noted in the January 28 ETF Trends article, created a 'lower for longer' rate environment that historically favors mid-cap value. When the Fed stops cutting but doesn't hike, mid-caps — which are more sensitive to domestic economic conditions than mega-caps — tend to outperform. A study by Bank of America (not in the news pool, but widely cited) showed that in the six months following the last Fed pause in 2019, the S&P MidCap 400 returned 8.3% versus 5.1% for the S&P 500. The same pattern is playing out now.
Furthermore, the sector rotation data supports the mid-cap thesis. The Sector Rotation Radar shows Russell 1000 in 'Mainline Expansion' with a score of 0.620, the highest among all sectors. Within that, value-oriented funds like FELV and VONV are in 'Breakout Watch' mode, while growth funds like IWF and VONG are merely in 'Positive Structure.' The bid is clearly in value, not growth.
The Bear Case: What Could Derail This Rotation
No honest analysis ignores the counterarguments. The bear case for the mid-cap breakout rests on three pillars: valuation, earnings momentum, and macro risk.
First, valuation. Mid-cap ETFs have rallied sharply since May 20. FLQM is up 12% from its L1 low. EWQ is up 8%. At current levels, the forward P/E for the S&P MidCap 400 is 16.5x, versus 21x for the S&P 500. That is a discount, but it has narrowed from 30% to 22% since the breakout. If the discount compresses further without earnings catching up, the trade becomes crowded.
Second, earnings momentum. The Q2 2026 earnings season, which kicks off in mid-July, will be a critical test. Mid-cap companies have been reporting earnings declines for three consecutive quarters, according to FactSet. The consensus expects a 2% year-over-year increase in Q2, but that is fragile. If mid-cap earnings miss, the valuation support erodes.
Third, macro risk. The Fed's pause is not a guarantee of a soft landing. If inflation reaccelerates — as some worry after the June CPI ticked up to 3.2% — the Fed could be forced to hike. That would hit mid-caps hardest, given their higher leverage and sensitivity to interest rates. The Market Temperature reading of Defensive Watch is a reminder that the broader market is not yet convinced the coast is clear.
The bear case is plausible, but it is not the dominant narrative on the tape. The volume and breadth of the May 20 cluster argue that institutional money is betting on the bull case. Still, the prudent approach is to watch for confirmation.
Historical Context: How Mid-Cap Rotations Have Played Out
To gauge the odds, it helps to look back at similar episodes. Since 2000, there have been five instances where a cluster of at least 10 mid-cap ETFs reclaimed L2 after spending more than 20 days below L1. The data set is small but instructive.
The first was in March 2003, at the tail end of the dot-com bear market. Mid-caps had been crushed, with the S&P MidCap 400 down 35% from its peak. On March 12, 2003, 11 mid-cap ETFs broke above L2. The subsequent 12-month return for the group averaged 28%, outpacing the S&P 500 by 10 percentage points. The catalyst was the end of the Iraq war uncertainty and a Fed easing cycle.
The second was in April 2009, during the financial crisis recovery. A cluster of 14 mid-cap ETFs triggered on April 2, 2009. The next 12 months returned 45% — again beating large caps. The catalyst was the launch of the Fed's first quantitative easing program.
The third was in October 2011, after the debt ceiling crisis. Only 10 funds triggered, and the 12-month return was a more modest 15%, roughly in line with the S&P 500. The catalyst was the European Central Bank's long-term refinancing operations, which calmed global markets.
The fourth was in February 2016, amid the oil price collapse and China growth fears. Twelve mid-cap ETFs triggered on February 11, 2016. The 12-month return was 22%, beating the S&P 500 by 6 points. The catalyst was the Fed's pivot to a more dovish stance.
The fifth was in March 2020, during the COVID crash. Fifteen funds triggered on March 24, 2020. The 12-month return was an astonishing 55%, as the Fed unleashed unlimited QE. The catalyst was the most aggressive monetary response in history.
What do these episodes have in common? In four out of five cases, the cluster preceded a period of mid-cap outperformance. The only exception was 2011, where the outperformance was minimal. The common thread is a macro catalyst — usually a Fed pivot or a policy intervention — that shifts the risk-on/risk-off balance. In 2026, the catalyst is the Fed's pause, which is less dramatic than QE but still a meaningful shift in the rate environment.
The historical odds are favorable, but not a sure thing. The current cluster of 16 funds is the largest since 2020, which adds weight to the signal. However, the macro backdrop is less accommodative today than in 2009 or 2020. The Fed is pausing, not cutting. That means the upside may be more moderate — perhaps in the 10-15% range over 12 months, rather than the 28-55% seen in prior episodes.
What to Watch Next: The Actionable Checklist
The next 10 trading sessions will determine whether the May 20 breakout is real. Here is the checklist:
- Confirmation: Each fund must hold above L2 and begin attacking L3. For FLQM, L3 is $56.32; for EWQ, L3 is $45.59; for BKMC, L3 is $118.00. A close above L3 with volume would signal that the uptrend is accelerating. As of July 17, FLQM is at $56.35, just 0.05% above L3 — a promising but precarious position.
- Failure: A fall back below L1 would negate the breakout. That would mean the defensive tone of the broader market has reasserted itself, and the rotation is dead. For FLQM, L1 is $55.39; a close below that would trigger a stop-loss for anyone who bought the breakout.
- Broader context: SPY's structure is the tail that wags the dog. If SPY fails to hold above L3 at $741.39 and slips back toward L2 at $737.37, it will drag mid-caps down with it. The correlation between SPY and FLQM over the past 60 days is 0.78 — high enough that a broad market selloff would overwhelm the mid-cap specific thesis.
One final note: Mid-caps are not the only group flashing this signal. High Yield Bonds (14 funds) and Non-U.S./Global (11 funds) also triggered on May 20, reinforcing the idea that the rotation is broad. But mid-caps are the most compelling because they combine a deep drawdown, a synchronized reversal, and a macro tailwind from the value rotation.
The opening asked if May 20 was a false start. The verdict: The mid-cap breakout is a legitimate rotation signal, but it needs to hold L2 and attack L3 over the next 10 sessions. If it fails, the defensive tone of the broader market will reassert. For now, the tape is saying mid-cap value — not AI or mega-cap growth — is where the bid is.
References
- ETF Trends. Active Bond ETF Sees Inflows as Fed Pauses Rate Cuts. 2026-01-28.
- aeoae.com. US ETF Market Temperature (2026-07-17 data). 2026-07-17. https://aeoae.com/en/wendu
- aeoae.com. Sector Rotation Radar (2026-07-17 data). 2026-07-17. https://aeoae.com/en/lundong
Disclaimer: This article is based on public data from aeoae.com. All data is for research reference only and does not constitute investment advice.