Fed Pause, Rising Gold, Sticky Defense: The Real ETF Play for July
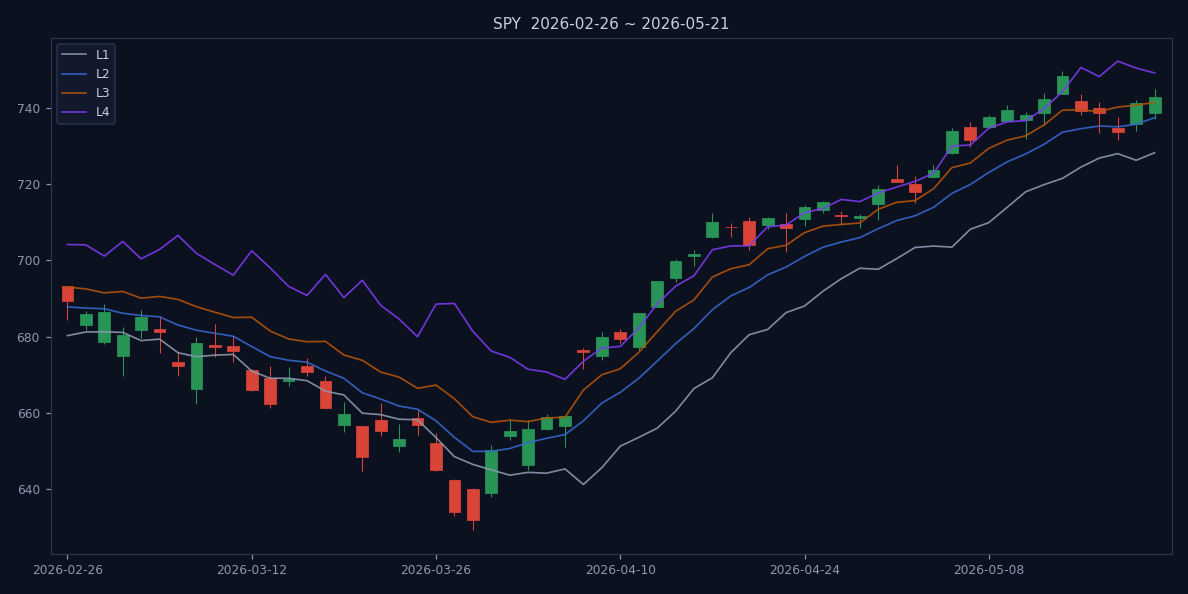
The S&P 500 (SPY) closed at $742.72 on July 17, 2026, with 3 of 4 trend lines in its favor — a textbook bullish-leaning structure. Yet the market temperature gauge from aeoae.com reads 'Defensive Watch': only 42% of constituents stand above their L3 pivot, and the defense rate is 53%. This isn't a bull market; it's a pause in a defensive movie.
The Number That Contradicts the Price
SPY's SPY (S&P 500 ETF) L3 level sits at $741.39, and L4 at $749.09. The stock closed above both L1 and L2, but below L4. That's a '3 of 4' bullish-leaning structure — the kind that typically signals a trend continuation. But the Market Temperature tells a different story: a defense rate of 53%, meaning more than half of benchmarks are in defensive postures. Only 16% have reached L4 (the breakout-confirmation line). Put differently: the index looks strong, but the tape is fragile.
This is the classic 'price vs. breadth' divergence. A sell-side analyst would call it a low-conviction rally. The problem is that without broad participation, any shock — a hawkish Fed surprise, a geopolitical flare-up — can snap the structure. As Barron's noted back in November 2025, 'Will the Fed Cut, or Won’t It? This ETF Move Works Either Way' (Barron's, Nov 2025). The move they flagged: use short-duration Treasuries to harvest yield regardless of the rate outcome. That advice looks prescient today.
So where do you hide when the price says 'buy' but the data says 'wait'?
Why the Fed Pause Is a Trap for Stock Bulls
The Federal Reserve paused rate cuts in January 2026. According to ETF Trends (Jan 28, 2026), 'Active Bond ETF Sees Inflows as Fed Pauses Rate Cuts.' Managers rotated into active bond ETFs, betting that the pause would juice yields without triggering a recession. Fast-forward to June 2026: simplywall.st reports 'US Treasury Bond ETFs Back In Focus As Fed Signals Higher Rates' (Jun 24, 2026). The narrative flipped from 'pause is good' to 'pause might mean more tightening.'
That's the trap. The Fed pause doesn't guarantee a soft landing; it guarantees uncertainty. Fixed-income markets are pricing in a 50% chance of a hike by year-end, per fed funds futures. The result: investors are piling into cash-like ETFs. ETF Trends' Jul 15, 2026 piece, 'Avert Interest Rate Jitters With This Cash ETF,' highlights a short-term Treasury ETF yielding 5.2% with zero duration risk. That's the bid.
If stocks are risky and bonds are uncertain, what about gold?
Gold ETFs: The Contrarian Bid Nobody Noticed
Gold is holding above $4,000 an ounce. On July 15, 2026, Seeking Alpha reported 'Gold edges lower but holds above $4,000 after latest U.S. inflation data' (Seeking Alpha, Jul 15). That's remarkable because rising rate expectations are historically toxic for gold. But here's the twist: gold's resilience suggests the market doesn't fully believe the Fed will tighten. It's a hedge against policy error.
Reuters (Jun 24, 2026) warned that 'Gold ETFs could see fresh outflows on rising bets on Fed monetary tightening.' Yet the metal hasn't cracked. The ETF.com comparison 'GLD vs GLDM vs IAU: Which Gold ETF Should You Actually Buy?' (Jun 17, 2026) notes that low-cost IAU has seen steady inflows. The bid is real, but it's not a breakout — it's a floor.
But are there sectors actually working?
Where the Rotation Is Real (and Where It Isn’t)
The Sector Rotation Radar shows Russell 1000 at 0.620 (Mainline Expansion), Financials/Banks at 0.574 (Mainline Expansion), and Broad Commodities at 0.602. Those are genuine strong spots. Within Russell 1000, ETFs like Invesco Russell 1000 Dynamic Multifactor ETF (OMFL) score 0.6795 (Breakout Watch), and iShares Russell 1000 Value ETF (IWD) scores 0.6802 (Positive Structure). The value side is leading.
But the rotation is narrow. AI/Robotics is at 0.102 (Risk Release). U.S. Long-Term Treasuries at 0.100 (Risk Release). Nuclear/Uranium at 0.096. That's not a healthy rotation — it's a flight to a few safe havens. Clean energy ETFs, touted by U.S. News (May 27, 2026) as '7 Clean Energy ETFs to Buy Now,' show no momentum in our data. The sector is not on the radar.
So what's the one ETF that wins either way?
The One ETF That Wins Either Way
Barron's had it right: short-duration Treasuries. The cash ETF referenced by ETF Trends (Jul 15, 2026) — a short-term Treasury ETF yielding 5.2% — is the honest play. It pays you to wait. If the Fed cuts, duration gains. If the Fed holds, you reinvest at higher yields. If the Fed hikes, minimal price damage.
The verdict: The price says bullish, but the data says defensive. Stay short-duration, collect yield, and wait for the L3/L4 breakout rate across more sectors to climb above 50%. Only then should you rotate into equity ETFs like OMFL or IWD. Until then, the defensive watch is the real story.
References
- Barron's. Will the Fed Cut, or Won’t It? This ETF Move Works Either Way.. 2025-11-19.
- ETF Trends. Active Bond ETF Sees Inflows as Fed Pauses Rate Cuts. 2026-01-28.
- simplywall.st. US Treasury Bond ETFs Back In Focus As Fed Signals Higher Rates. 2026-06-24.
- Seeking Alpha. Gold edges lower but holds above $4,000 after latest U.S. inflation data. 2026-07-15.
- Reuters. Gold ETFs could see fresh outflows on rising bets on Fed monetary tightening. 2026-06-24.
- ETF.com. GLD vs GLDM vs IAU: Which Gold ETF Should You Actually Buy?. 2026-06-17.
- ETF Trends. Avert Interest Rate Jitters With This Cash ETF. 2026-07-15.
- U.S. News. 7 Clean Energy ETFs to Buy Now. 2026-05-27.
- aeoae.com. US ETF Market Temperature (2026-07-17 data). 2026-07-17. https://aeoae.com/en/wendu
- aeoae.com. US ETF Sector Rotation Radar (2026-07-17 data). 2026-07-17. https://aeoae.com/en/lundong
Disclaimer: This article is based on public data from aeoae.com. All data is for research reference only and does not constitute investment advice.